Teams wonder why their journey mapping projects do not succeed and, at the same time, fail to integrate critical data into their maps. The data that could transform these maps from static visuals into dynamic, actionable instruments s that drive informed, strategic decisions. Imagine if your map could be more than just a visual—if it could become the go-to source of truth for your organization, bringing together everything you need to understand your customers.
Picture having all your key customer journey data from different sources and team inputs seamlessly integrated into one comprehensive map. This map isn’t just a visual guide; it’s a dynamic knowledge hub that captures the full scope of your customer personas' experience. By consolidating data from marketing, sales, support, and product teams, you can create a powerful, centralized resource that evolves in real time with your customers' needs.
This article will dive into practical data inclusion strategies with examples for enriching your journey map with diverse data types. From customer feedback and survey results to behavioral analytics, you'll discover how to transform your map into a valuable tool that keeps your teams aligned and your strategies focused. If you prefer watching instead of reading, we've got you covered. At the end of this article, you’ll find a recording of an event covering the same topic.
Ready to turn your journey map into a data powerhouse? Let's get started!
Contents
Types of customer journey data with examples
To understand and optimize customer journeys, gathering and analyzing diverse data types is essential. So, create a comprehensive view that enhances decision-making by embedding data from various sources directly into your digital maps.
Whether you have clickstream data from websites, survey responses, social media interaction details, or behavioral data, embedding these data points into your map will help you visually represent customers' experience, allowing teams to identify patterns, spot pain points, and drive strategic improvements.
Here are some examples of customer journey data across different categories to inspire and help you optimize customer interactions and, of course, improve the experiences. Note: These examples are crafted in the UXPressia journey mapping tool.
Poll and survey data
Poll and survey data are invaluable for understanding customer perceptions, motivations, and satisfaction at various stages of their journey.
Chances are that researchers, marketers, customer success, customer support, and other teams inside your organization run polls and surveys. No wonder these are invaluable for understanding customer perceptions, motivations, and satisfaction at various stages of their journey. So embedding those into your map can be a simple solution for having all journey-related data easily accessible from the map itself.
What to include and why:
- Customer Satisfaction (CSAT) Score. Track customers' satisfaction at different touchpoints, such as after purchase or during customer support interactions.
- NPS. Identify promoters and detractors to understand loyalty and the likelihood of customers recommending your brand.
- Feedback on specific touchpoints. Use survey responses to understand what works well and what needs improvement at different journey stages.
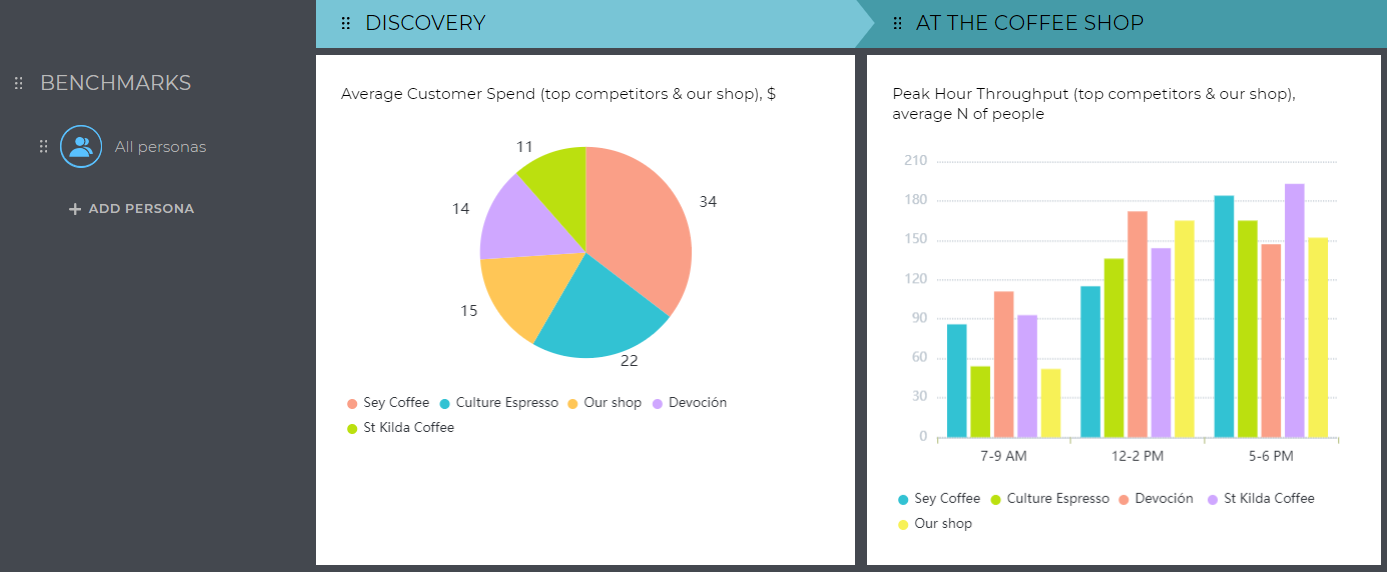
UXPressia tip: In UXPressia, you can easily organize your poll and survey responses into visual formats like charts and graphs, making it simple to see critical insights at a glance. For even more flexibility, you can embed your Google Sheets, where responses are collected, directly into your journey map.
Online boards
Embedding online boards from tools like Miro, FigJam, Trello, or other collaborative platforms into your digital journey map can significantly enhance your workflow by making all relevant project information easily accessible.
Online boards are frequently used for brainstorming sessions, project planning, visualizing strategic goals, conducting competitor analysis, and much more. Integrating these resources into your journey map ensures that critical data, insights, and plans are only a click away, streamlining collaboration and keeping your team aligned.
What to include and why:
- Workshop plans and strategic visuals. Embed planning documents, workshop boards, and visual strategic plans directly into your map. That will keep all relevant information within reach, helping your team reference essential materials during discussions.
- Raw research data. If your research data is scattered across different online boards, embedding them within your map ensures that all relevant information is centralized. This approach makes it easy for teams to access data-driven insights while analyzing customer journeys.
- Competitor analysis. Including competitor analysis from online boards can save you time when comparing current strategies with market standards. This visual aid can deepen the understanding of market positioning and customer expectations.
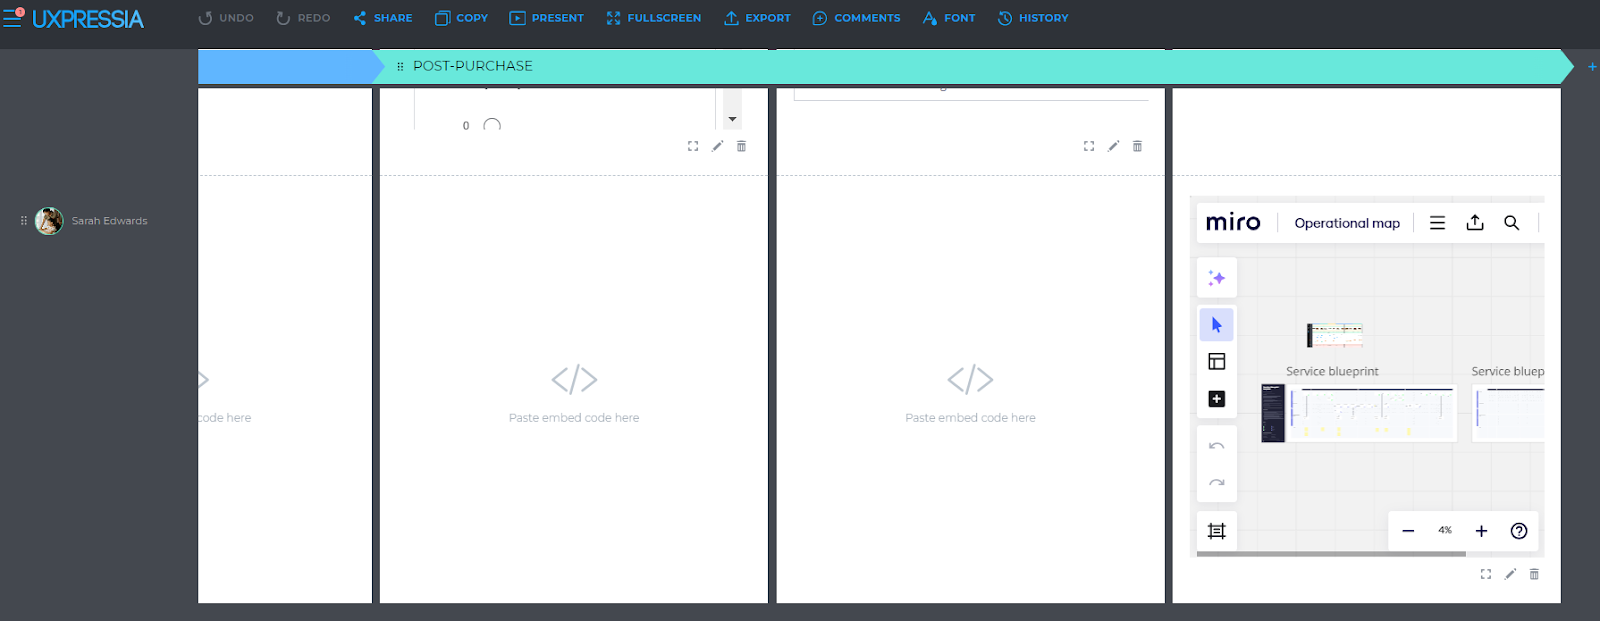
UXPressia tip: In UXPressia, integrating online boards into your journey map is straightforward. You can embed external links different platforms directly into your map sections, turning your static journey map into an interactive experience.
Different teams within your organization often use various tools to manage and store customer data, and integrating this information into your journey map can create a comprehensive, unified view of the customer experience.
What to include and why:
- Customer success plans. Embedding individual customer plans directly into the map allows your team to access real-time updates, track progress, and quickly address any issues, providing a seamless flow of information across departments.
- Sales data and requests. Integrate sales databases, like those in Notion, to keep track of customization requests and other sales-specific data. This way, you'll keeps all information centralized and make it easy to find, enabling better coordination between Customer Success and Sales teams.
- Sales CRM data. Embedding data via direct links from your sales CRM directly into specific stages of your journey map allows you to connect real-time information about leads, deal status, and customer interactions to relevant personas or journey stages. For example, link data on customer interactions to the decision-making stage of your map or connect lead details to a specific persona. This integration will provide a clear view of how each persona progresses through the sales pipeline, offering actionable insights to enhance the customer experience and streamline sales strategies.
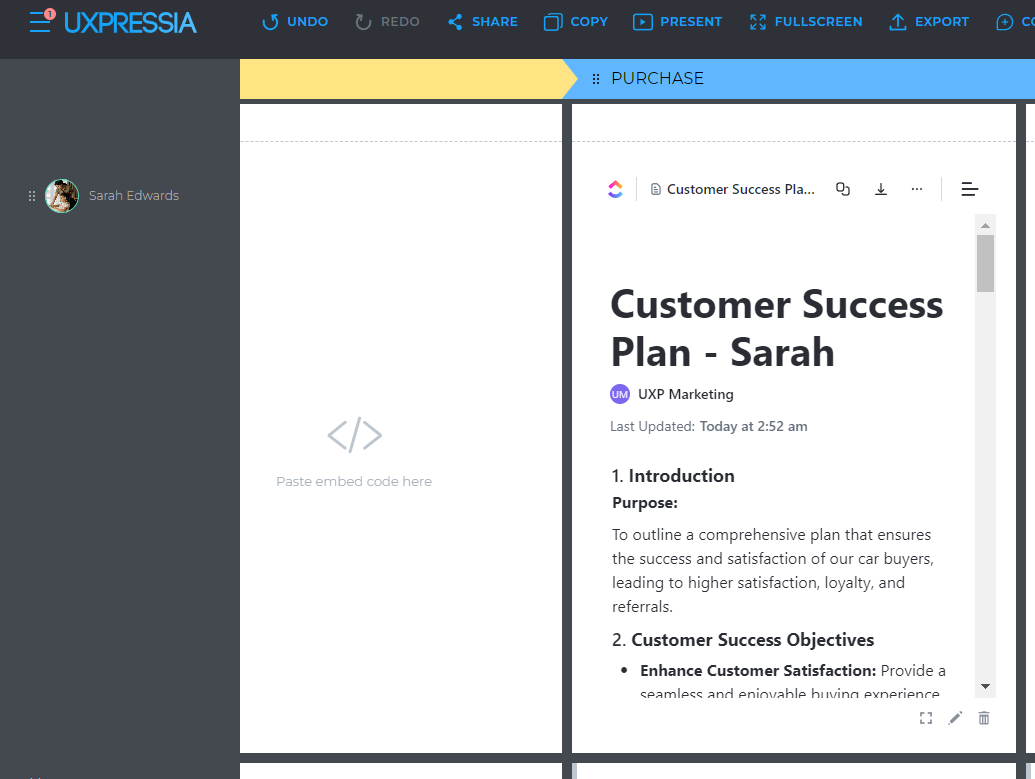
UXPressia tip: In UXPressia, embedding external tools like ClickUp, Notion, or sales CRM systems is straightforward. Use the embed code feature to link these tools directly into your journey map sections. For tools like Notion, which do not have native embed capabilities, you can use third-party services to generate embed links and then integrate them into your map.
Customer interviews and introductory videos
Customer interviews, testing sessions, and similar activities are invaluable sources of qualitative data that can significantly enhance your understanding of customer experiences. Integrating these insights directly into your journey map allows you to confirm customer experience data points, validate assumptions, and back up strategic ideas with real-world feedback.
What to include and why:
- Customer interviews and testing sessions. By embedding recordings or highlights of these sessions into specific stages of your journey map, you can easily cross-reference real customer feedback with the touchpoints you're analyzing. This not only enriches the map with context but also provides concrete evidence to support proposed improvements or validate existing strategies.
- Recorded walkthroughs and introductory videos. When sharing the map with new team members or stakeholders, embedding a short introductory video (e.g., recorded on Loom) can help them quickly grasp the map’s essence, making it easier for them to engage with the information. That is particularly useful for those who haven’t been involved in the mapping process and need a concise walkthrough of the critical insights and objectives.
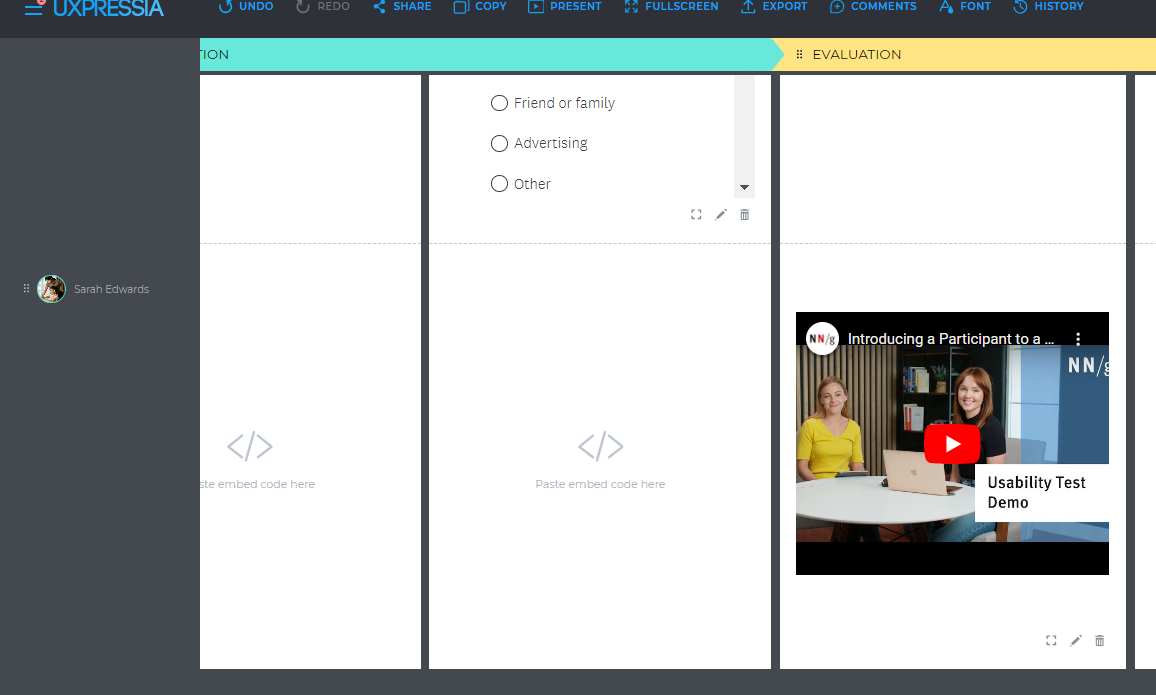
UXPressia tip: UXPressia supports seamless embedding of various media types, including video recordings and session summaries.
Marketing and sales content
For sales, marketing, and content teams, embedding relevant content directly into the journey map can be a game-changer. It allows teams to see where resources fit within the customer journey and ensures that every stage is supported with the right materials. Embedding content like blog posts, presentations, and other marketing collateral helps you quickly identify gaps in your content strategy and make sure every touchpoint is well-equipped to meet customer needs.
What to include and why:
- Sales presentations and pitches. Embed presentations or sales pitches aimed for specific customer personas or broader target groups. These assets help ensure that sales teams can directly address the needs, concerns, and motivations of each persona during decision-making stages of the journey.
- Marketing collateral. Incorporate relevant content like blog posts, case studies, e-books, and white papers that align with each stage of the customer journey. This integration makes it easy to access the right information at the right time, helping your team identify content gaps or outdated materials that need refreshing.
- Persona-specific content. If your marketing strategy includes materials tailored to particular personas, such as videos or articles designed to engage a specific audience, having links to those within the map is a good idea. This approach keeps content easily accessible and ensures that teams can leverage persona-focused materials to enhance customer engagement.
- Drafts and work-in-progress content. Embed drafts of marketing presentations or content ideas that are still under development.
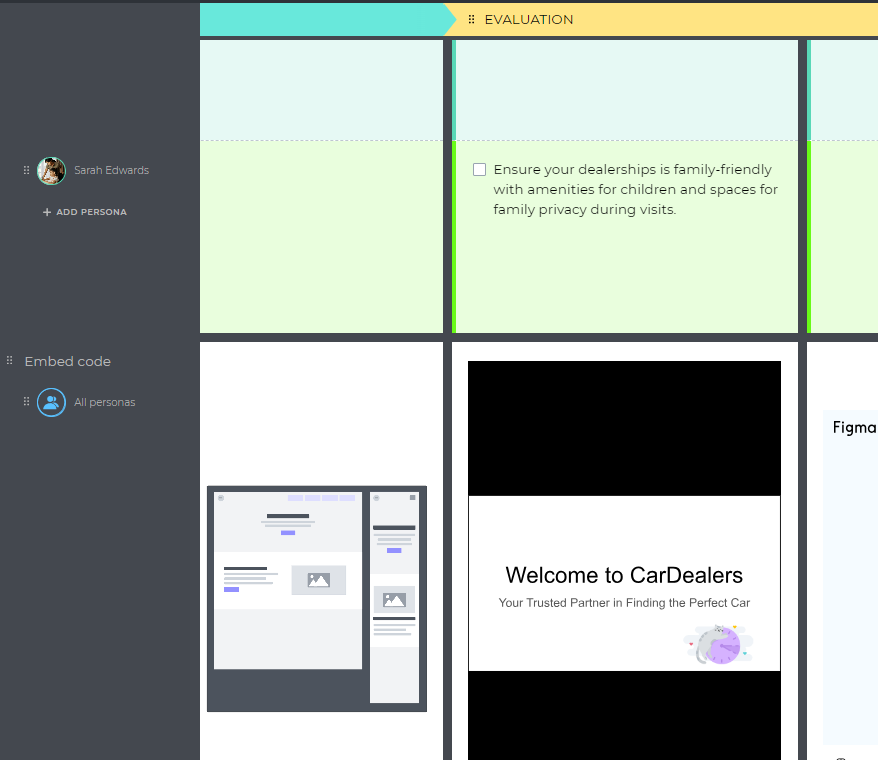
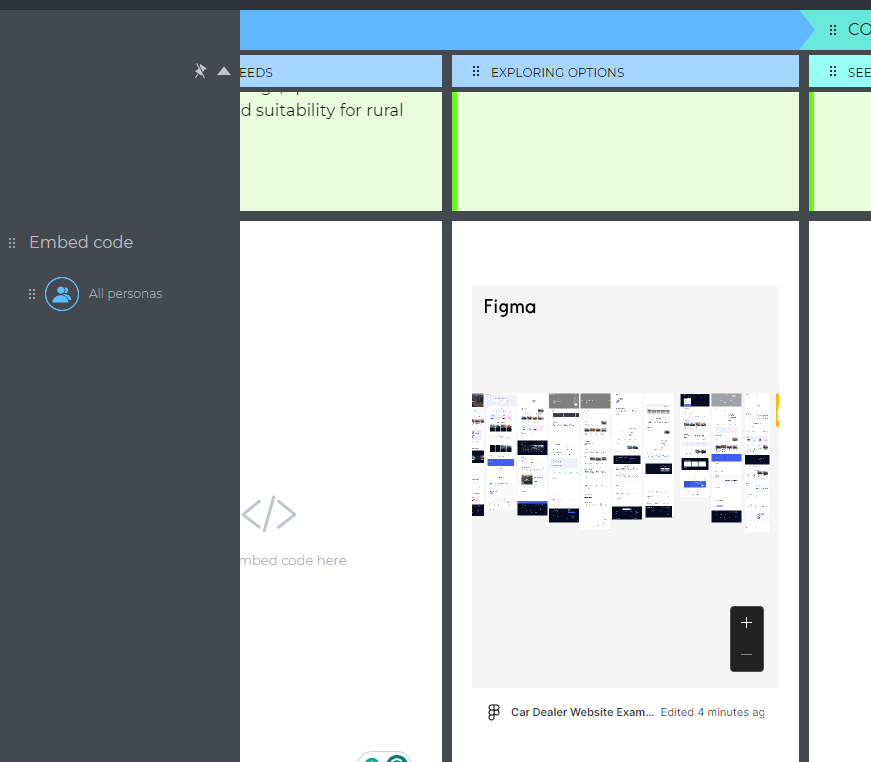
Design files, wireframes, and prototypes
Design files, wireframes, and prototypes are crucial visual elements that help teams stay aligned during the journey mapping process. Embedding these assets into your journey map allows everyone involved—designers, marketers, developers, and stakeholders—to see the design's evolution and its alignment with user needs and expectations at different stages. Here's how and why you should include them:
- Design prototypes. By embedding prototypes from tools like Figma, Adobe XD, or Sketch directly into your map, your team can see the latest designs in context. This integration ensures that all updates are accessible and visible within the journey map, keeping everyone on the same page and facilitating collaborative feedback. For instance, if you’re working on a website redesign, embedding prototypes enables team members to view the user interface as it develops, helping validate that the design meets the customer’s needs highlighted in the journey map.
- Wireframes. Wireframes, especially those created using platforms like LucidChart or Balsamiq, provide a simplified visual of the layout and navigation paths. Embedding these in the journey map helps visualize how information and design elements are placed to support user tasks at various journey stages. For example, a car dealership might embed wireframes of their website's booking system to showcase how it aligns with customer expectations during decision-making.
- Design files. Embedding ongoing design work allows teams to vote on design choices, propose changes, and ensure consistency with the overall customer experience strategy. This collaborative approach can streamline decision-making, prevent miscommunication, and keep the design process agile and user-focused.
CX metrics
Incorporating CX metrics into your journey map provides a data-driven foundation to validate assumptions, identify pain points, and measure the effectiveness of touchpoints throughout the customer journey. Embedding such statistical data directly into your map allows your team to see the quantitative side of the customer experience, enhancing the map's ability to guide strategic improvements.
What to include and why:
- Customer Effort Score (CES). CES measures how easy it is for customers to complete an action, such as resolving an issue or navigating the website. By embedding CES scores, your map highlights friction points where customers might struggle, allowing teams to streamline processes and reduce effort at key stages.
- Churn rates and retention metrics. Including metrics on churn rates helps you identify where and why customers are dropping off. Mapping these insights reveals critical stages where intervention could reduce churn and improve retention, helping you refine customer touchpoints to encourage loyalty.

UXPressia tip: UXPressia supports embedding CX metrics, allowing you to visualize data as graphs and charts within your digital customer journey map. With embedded metrics, you can track progress, validate changes, and continuously optimize the customer journey based on up-to-date performance insights.
Conclusion
Bringing all your customer journey data together in one map doesn’t just make it look nice—it turns your map into a true powerhouse for your team. By embedding insights from surveys, metrics, design prototypes, and more, your journey map becomes a living, breathing tool that helps everyone stay on the same page.
This approach keeps your teams—whether they’re in marketing, sales, or product development—aligned with the latest data, helping you make smarter, faster decisions. You can spot where customers are happy, where they’re struggling, and where you have the chance to shine. Embedding these insights directly into your map means you’re not just seeing a snapshot of the customer experience; you’re constantly updating and optimizing it in real time.
The result? A map that doesn’t just tell you where your customers are—it shows you how to get them where they want to go. It’s all about making your strategy sharper, your teams more connected, and your customer experience better than ever.
Сustomer journey data ideas: video
Here’s the promised video where you can see each of our suggested tips in action. Watch how they work in real-life scenarios and get inspired to apply these strategies to your own projects: