Out in the journey mapping world, one might hear different names for horizontal map rows: lanes, swimlanes, sections, or layers. Together with vertical rows, or stages, they make up a full-fledged customer journey map.
If you look at the different examples on the internet, you’ll find that there is no standard — no two maps are the same. Some layers, however, tend to be more indispensable and are frequently used by CX professionals and enthusiasts alike.
In this blog post, we'll show you examples and best practices of using layers to your mapping benefit. And to back up our tips, we've gathered some hard data: statistics on the most popular customer journey map layers that UXPressia’s users choose.
Contents
The must-have customer journey map layers
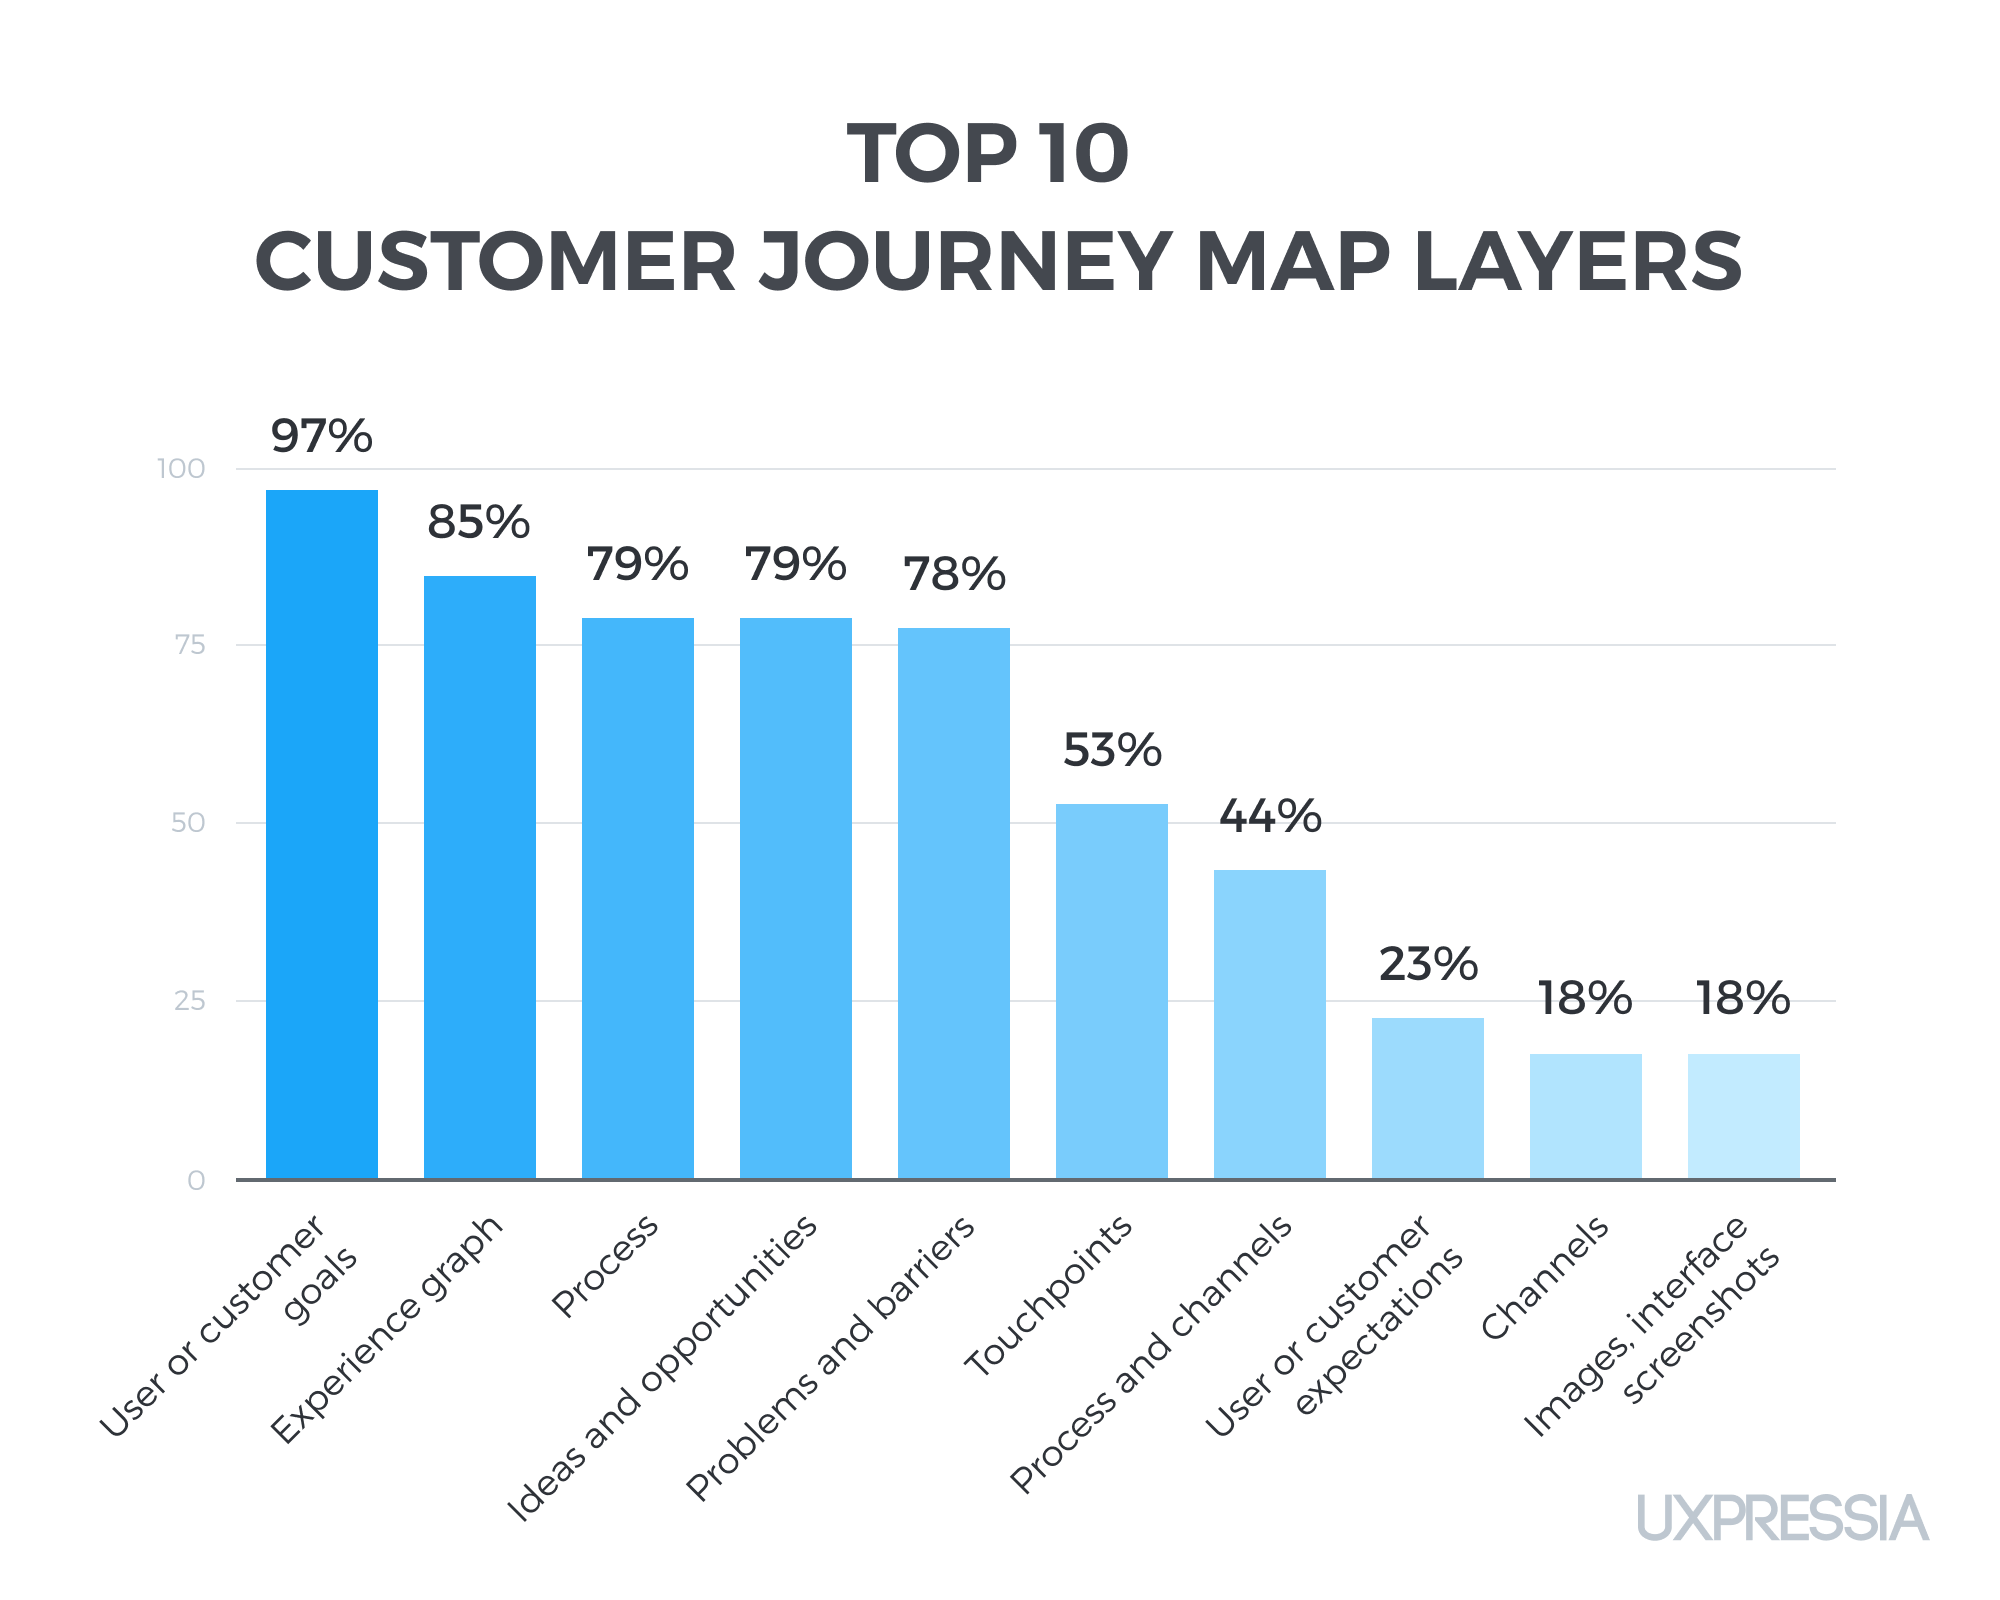
Let’s start with the essential layers that help you look at your customer experience through the right lens. We have analyzed the data on tens of thousands of customer journey maps created in UXPressia and ranked the layers according to their popularity.
Here’s the graph we ended up with:
And before we dive deeper into each layer’s meaning and purpose, let’s see what all of them look like when put together on a customer journey map:

This map visualizes an end-to-end museum visitor journey, from first finding out about an art gallery all the way through to the actual visit and leaving a review afterwards. Below, we’ll zoom in on different parts of the map to illustrate how different layers are used.
Customer goals, needs, and expectations
According to our statistics, 'Customer goals' is the most popular map layer. It is present in 97% of all the journey maps created in UXPressia.
To make a good customer journey map, you need to know what your personas want. This knowledge helps you develop empathy towards them and understand their goal at each stage of the journey. By reflecting that data on the map, you can ensure that everything you do is helping the customer achieve their purpose.
As for expectations, they have the power to change customers’ impressions and influence the overall journey. Most expectations are based on previous experiences or word of mouth. For instance, the persona reads on a review site that your product or service comes with a 25% first-timer discount. And if they don’t receive it for some reason, they might even decide against the purchase. By knowing and seeing these assumptions and projections on the map, you can meet or exceed them.
So where can you find all that information like goals or needs to add to your map? Well, you’ll need to do research to learn more about your customers, be it the users of your online solution, your property visitors, product buyers, or even your employees (if you’re aiming to improve the employee experience).
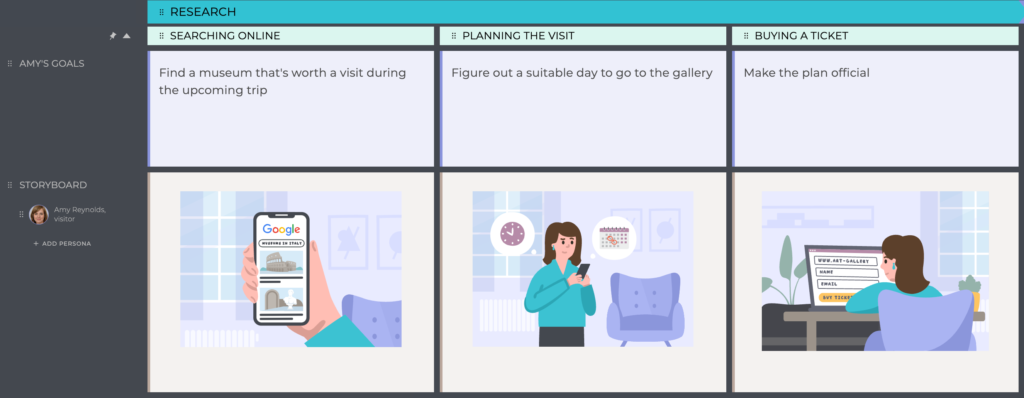
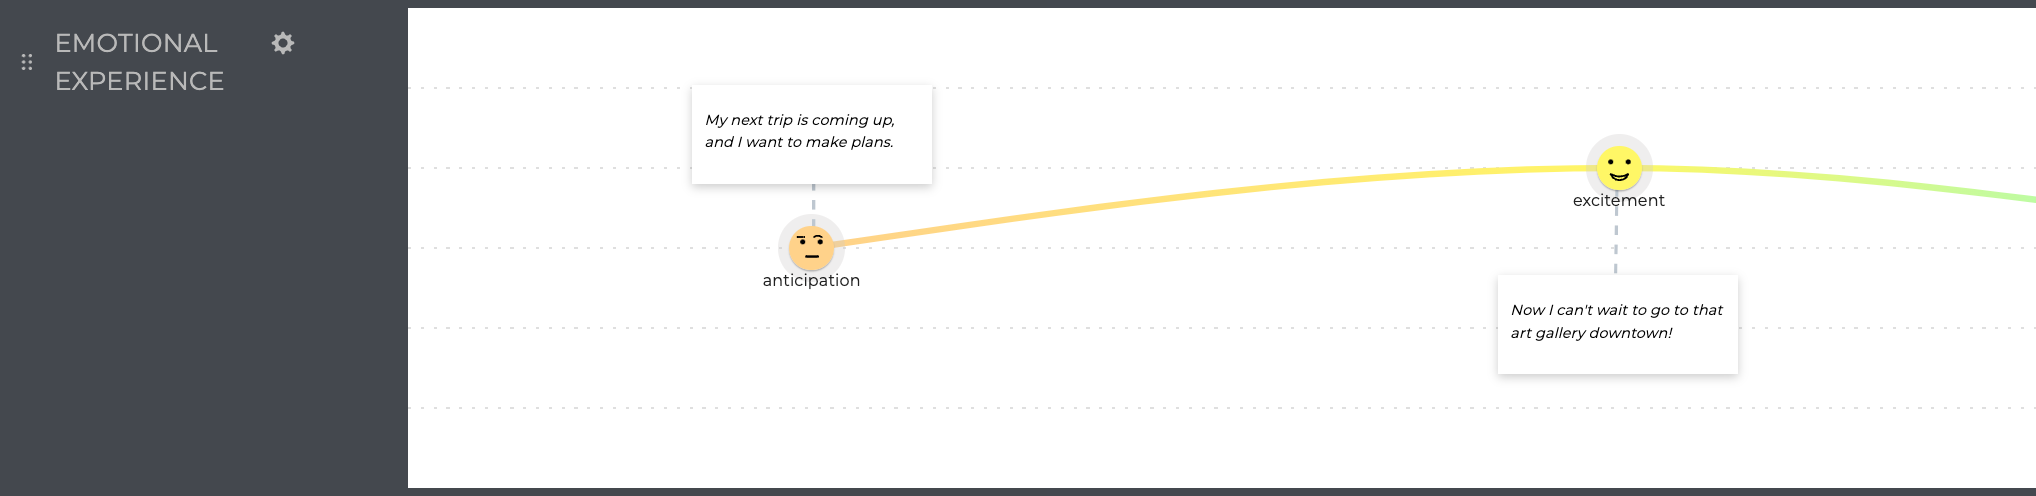
In our example map, Amy, the persona, is looking to visit a museum. Some of her goals at the first stages of awareness and consideration are quite simple: adding the visit to her calendar and making her plans official by buying a ticket.
Processes, channels, and touchpoints
Another group of layers a journey map can't do without are:
- Processes.
The process layer, present in 79% of all UXPressia journey maps, refers to the steps customers go through or actions they take when interacting with your brand.
It introduces context on how exactly people navigate their journey and might also help you spot some pain points and inconsistencies right away. You'll see where bottlenecks occur and what personas from your company are involved.
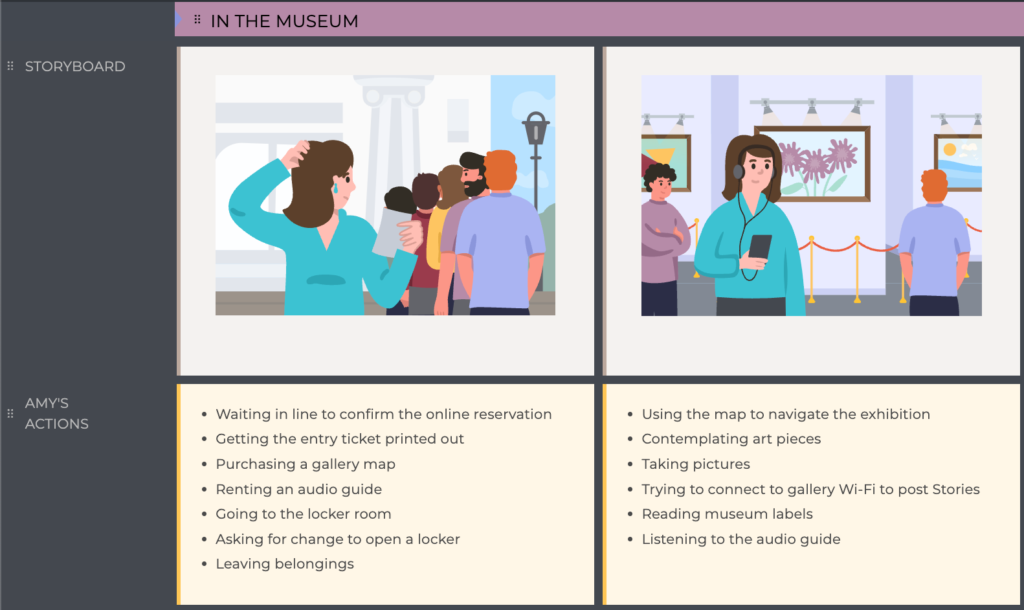
To describe the process, we’ve put down a list of actions that our example persona completes. Just from them, we can see that there are some organizational issues that may take away from the customer experience. For instance, Amy has to wait in line and go back and forth to ask for change for the lockers, which frustrates her.
- Channels and touchpoints.
Channels are a medium of communication between a customer and your company. A touchpoint, in turn, is a moment in time of interaction with your product, service, or brand. The Touchpoint layer is used in 53% of UXPressia journey maps.
To fill out these two layers, think of what you already know about the processes during each stage, and reconstruct the action chain once again. This time, pay attention to the customers’ intersections with your business.
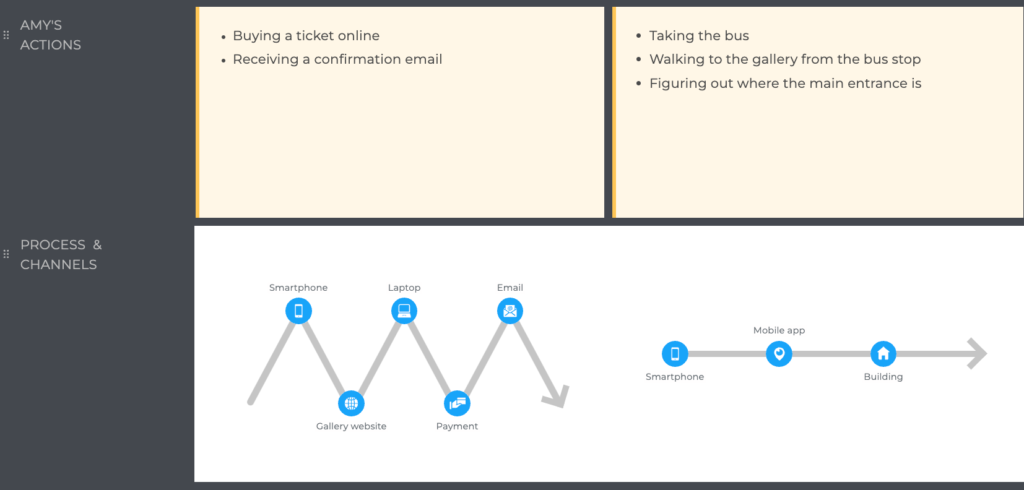
In Amy’s journey map, we’ve put the processes and channels together on the same graph. For example, when buying an online ticket, she first tries to do it from her phone. But the booking systems’ service won’t work on mobile devices, so she has to switch to a laptop. Once the payment goes through, Amy receives a confirmation email.
And here’s how a ‘Reading reviews’ touchpoint may look like on the map and expanded further:
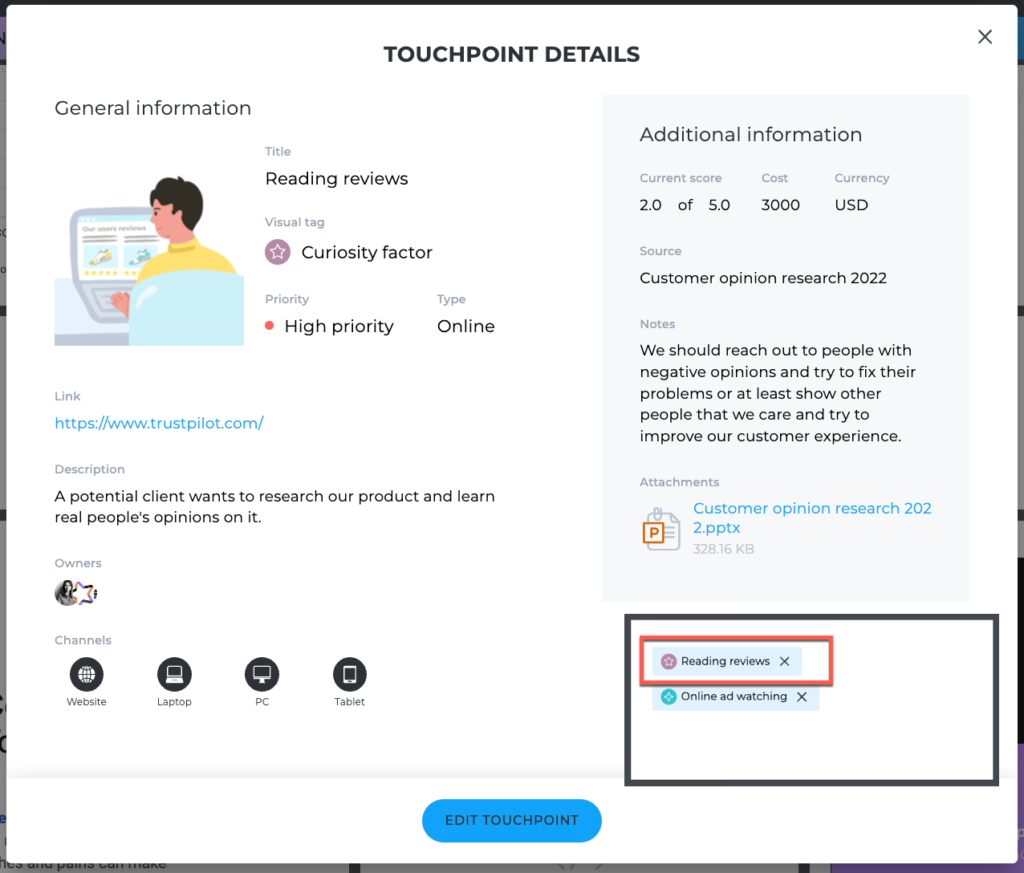
Why look into channels and touchpoints in the first place? Even a single bad interaction can lead to the customer finishing their journey with your brand earlier than expected and never coming back. So visualizing interactions on the map is the key to getting a holistic view of the customer experience.
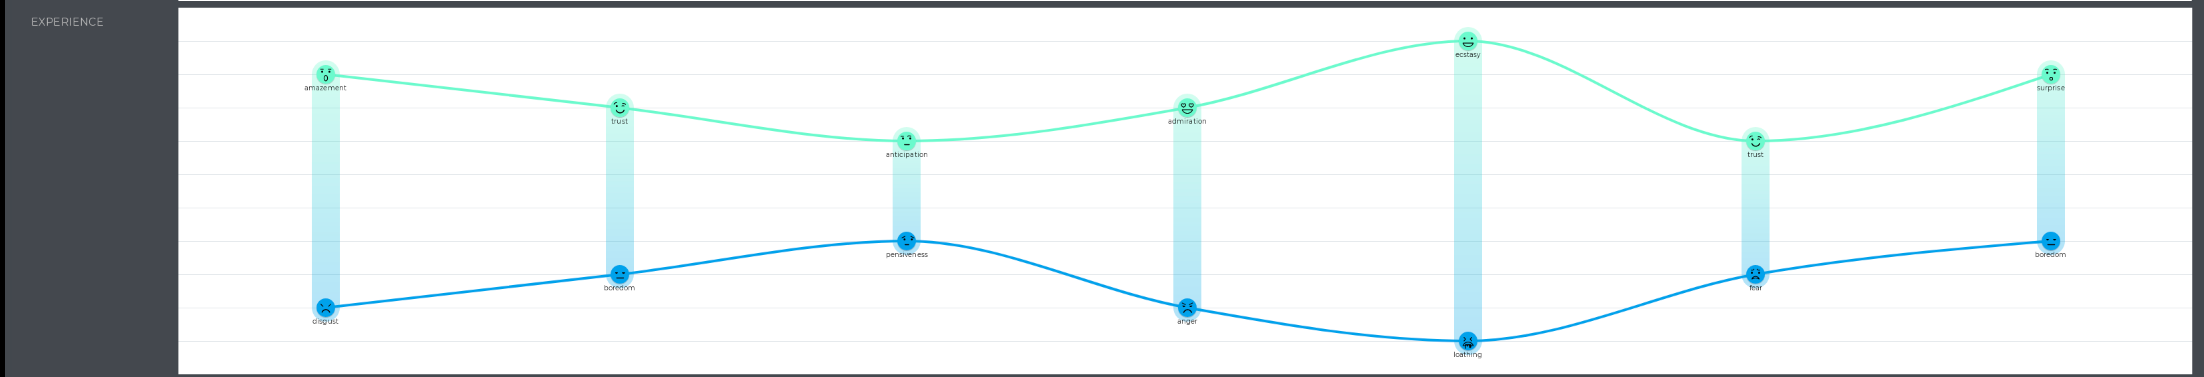
Experience, Think & Feel
An experience graph visualizes the customer emotions at each stage of the journey. This section is the second most frequently used layer after 'Customer Goals', present in 85% of UXPressia's customer journey maps.
Having a graph to represent the emotional journey a customer goes through can be very powerful. It gives you a one-look overview of how the journey is going and evokes empathy towards the persona's feelings. That can be especially helpful when presenting the map to other departments in your organization. The 'lows' in the graph give you a legitimate reason to zoom into those stages and discuss why customer experience is lacking.
Quotes in the 'Think & feel' layer let you go beyond plain data: these are not just some fictional customers but real people out there and their actual words and reactions. Looking at the two customer journey map layers together with your team can be very moving and create a sense of unity among all frontline departments like customer support, service, or sales.
To gather data to fill out these sections, you can look at support or call logs, research interview quotes, chats, posts on review platforms, or any other medium across your company where your customers have an opportunity to speak out.
As for future-state customer journey maps, you could still make use of the layers: put down the 'ideal' experience that you want your customer to have and bring it to life with behavioral science principles.
Pain points, Ideas & Opportunities
Problems and opportunities, layers present in 78% of UXPressia’s maps, refer to the challenges customers face on certain stages and the areas of opportunity throughout the entire customer journey. By addressing pain points, you can improve the overall experience.
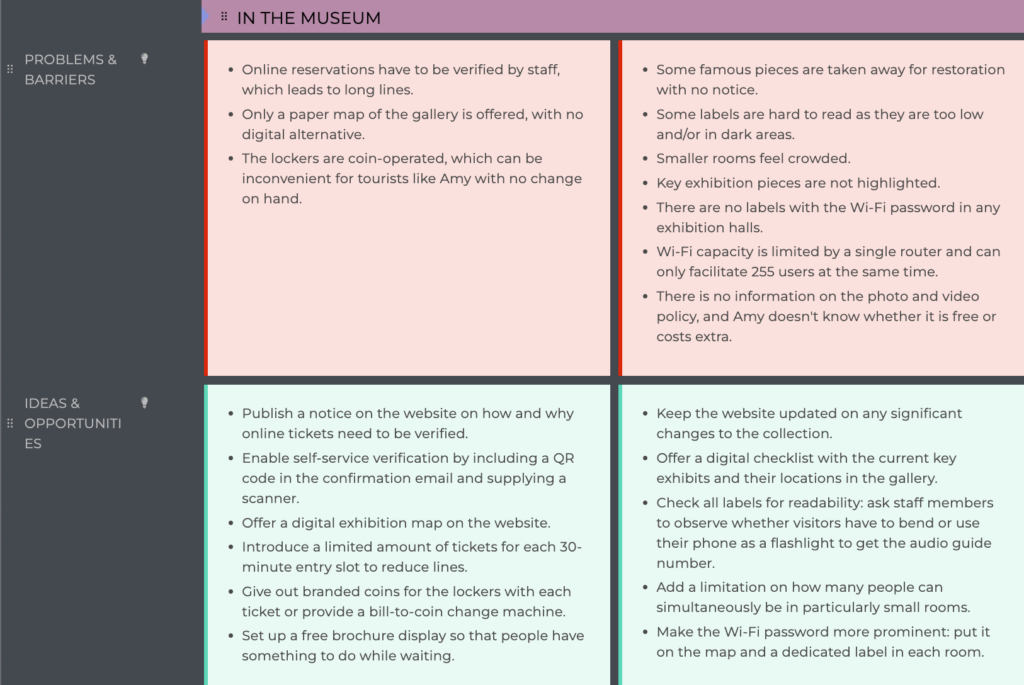
In Amy’s journey, we see the following roadblocks:
- Flaws in the process: having to go back to the ticket desk to ask for change for the lockers, running into maximum Wi-Fi capacity;
- Time-related problems: waiting in line for the staff to verify her ticket;
- An issue with costs: worrying about whether taking pictures isn’t free;
- And so on.
To pinpoint the difficulties your customers have along their journey, you can go back to the research data and interviews you’ve used for persona creation, turn to online reviews, or talk to front-facing departments. As for coming up with ways to fix those issues, you can refer to our free ideation cheat cards to aid your brainstorming.
Bonus customer journey map layers
Covering the basic map layers is a solid starting point. But a great customer journey map goes beyond that. To make your documents even more actionable and have them lead to changes, you will need to go for additional layers.
Images, videos, and documents
Adding videos and images to your map is a great way to unleash the visualization power. For instance, you can include:
- Storyboards;
- Interface and newsletter screenshots, photos of the packaging and environment, or anything else that customers see;
- Customer interview recordings, YouTube videos, or guides;
- Design mockups, prototypes, sketches, email campaign drafts, and other marketing assets.
If you use UXPressia, you can also add live visuals via the Embed code section. This could be your webpages or previous journey template from prototyping tools like Figma, Miro, or InVision.
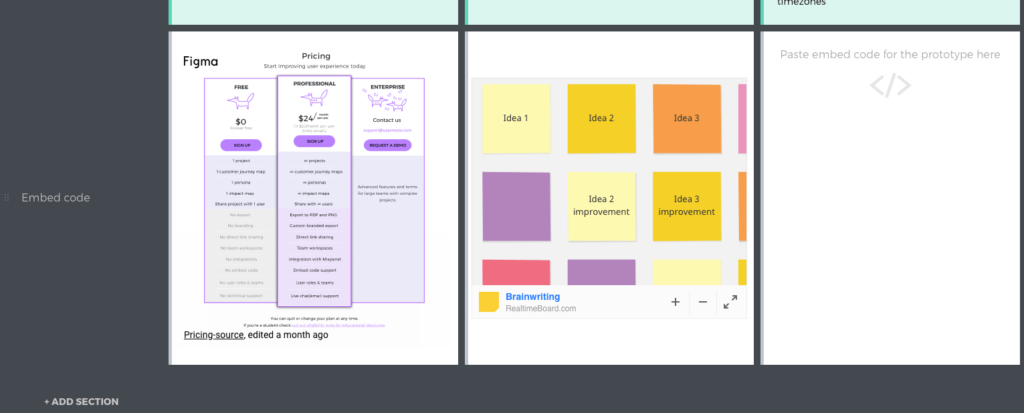
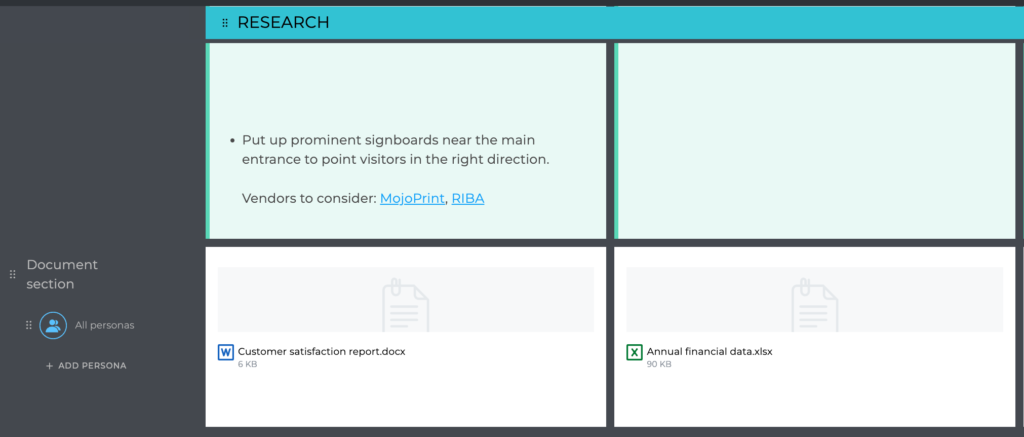
As for documents, a dedicated file lane will let you incorporate research findings, reports, leaflets and brochures, or any other business assets that you feel are relevant to a specific journey map stage. Alternatively, you can insert links to Google Docs, Sheets, or other file sources in the text of your cells.
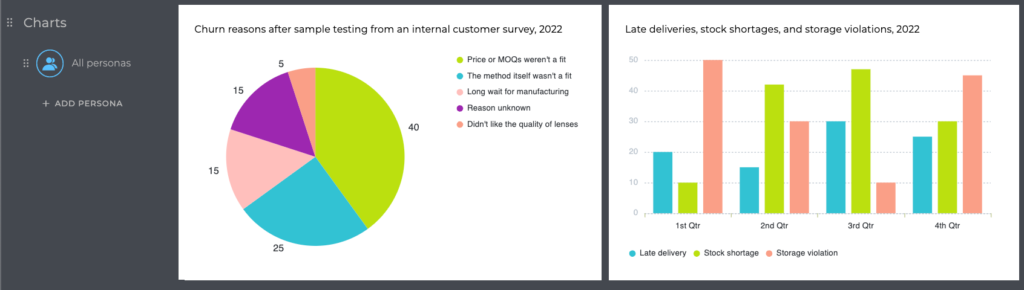
Charts and graphs
Charts and graphs on a customer journey map give you a visual representation of data to easily interpret it. Bar charts are often used to track changes over time. Alternatively, you can compare different groups with it: for example, customer satisfaction ratings between age groups. Pie charts, on the other hand, show you the distribution of parts of a whole, such as, say, traffic distribution by sources.
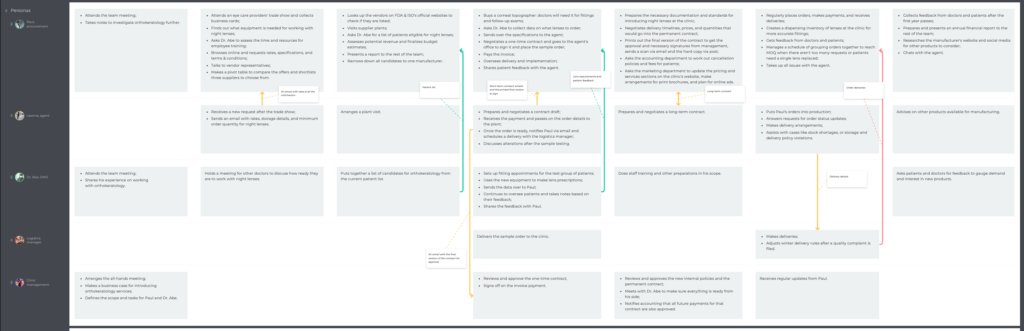
Interactions
In most journeys, there is a central actor: your persona. However, there can be other supporting characters that participate in the same journey and can have an impact on each other.
For a B2B customer journey, that could be colleagues, supervisors, or stakeholders that work with the main persona and can influence their decision. For a B2C one — all the staff members the persona interacts with at one point or another.
To visualize all those interactions and gain more insight into how they affect the overall customer experience or to have a record of all the artifacts that are exchanged, you can use a dedicated map section. The likes of this one:
Analytics and tasks
An effective customer journey map can't do without these two layers as well.
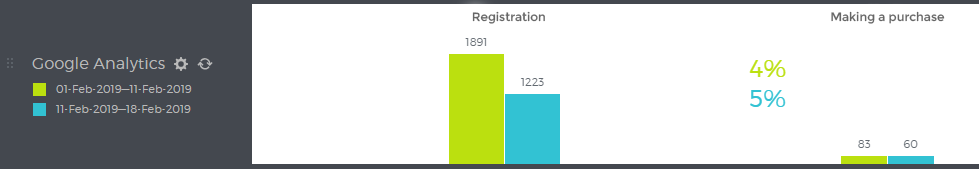
Backing up your map with analytics will balance the empathy and strengthen your pitch. For instance, you can add a web analytics layer to see how many people visit your online resources, monitor marketing campaign results within the context of the journey, and a lot more.
If you’re going to turn your document into a product roadmap or formulate a list of tasks for the team based on your customer insights and business goals, you can add sections just for that. UXPressia supports Jira integration, so you'll have access to your Jira issues right from the map.

Final words on customer journey map layers
Now you know the most popular map layers and the value each of them can bring to customer journeys. Unfortunately, there isn't a universal combination of layers that will guarantee you a great customer journey map. You'll have to figure out the right blend for your business in every project, use case, and audience. But the more versatility in choices your mapping tool gives you, the higher your chances for capturing a true-to-life customer journey that inspires change.
Sign up for a free account with UXPressia, and start creating maps with the 20+ different customer journey layers we have.


We also use quotes and documents a lot in our maps. Was surprised to see such a small number for images at first, but then I thought, people must insert them into other customer journey layers instead of adding a separate section. Seems more convenient since you can add a text note or a link there as well.
Comments are reviewed before they appear.