Back in May, we reached out to our users asking them to participate in the research where we investigated software and techniques used when working with customer journey mapping.
Our request was successful: 150 customer experience professionals filled in the questionnaire; we conducted 14 in-depth interviews.
It took our researchers a while to compile survey results into a report. Today, we are going to share its takeaways with you.
Spoiler: the download link on the customer journey research is at the end of the post.
Survey participants
Customer experience professionals from 21 countries took part in the survey.
The majority of respondents were UX professionals, followed by CX professionals, Product/Project Managers, and consultants.
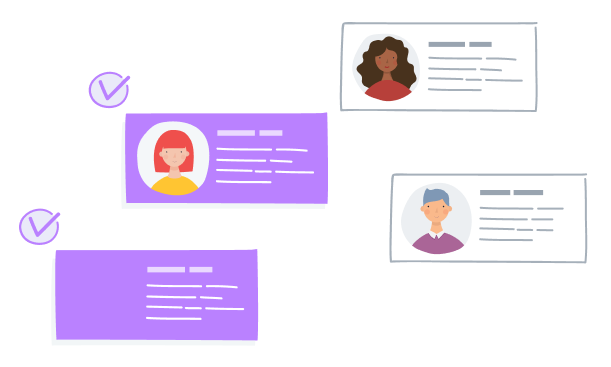
Follow-up interviews
The interviewees represented different industries: finance, B2B, healthcare, entertainment, information technology, logistics, multiple industries (agents), and government.
Key research highlights
The survey revealed that 52.2% of respondents don’t use any software for researching, storing, and analyzing their findings.
Top five data sources for CJMs
- Interviews with users and customers
- Survey participants’ own ideas and hypotheses
- Team discussions
- Observations
- Online surveys
Key complementary techniques
- Personas
- Brainstorming
- Usability testing
- Business model canvas
- Experience prototyping
- Mind mapping
Digital vs non-digital tools
Using software during workshops feels “less comfortable” and the interviewees find digital tools less interactive. Non-digital tools (e.g., a notebook and pen and sticky notes) are still extremely popular.

Customer journey map as a living document
For product teams, a customer journey map has more value when it becomes a “living document” that is constantly updated. But keeping a map up to date manually requires a lot of resources.
For instance, analysts in data-driven companies often perform complex calculations prior to presenting any results to stakeholders and rarely use raw data from analytics tools.
Download the full research report
Enter your details below to get the download link in your inbox.