Journey mapping is a great technique when done right. One of the critical things for the success of such a project is deciding what CX metrics to monitor. Without these metrics, you won’t know what impact you are making on your customer journeys.
At our recent event, Keith Kmett, Principal Customer Experience Advisor for Medallia, shared his almost 20 years of experience doing journey mapping and talked about some of the best practices he has found during his career.
Read on to get a quick introduction to what journey maps are, discover a practical approach to prioritizing which journeys to map first, and learn how to choose the metrics for measuring customer journey performance. Plus, you will find a real-life example of bringing a journey map to life with UXPressia’s journey map tool.
If you don’t feel like reading, scroll down to the article’s end to watch the event recording.
Contents
A quick overview of journey maps
First and foremost, a journey map is a communication tool to visually illustrate customers’ actions, needs, and perceptions throughout their relationships with a company.
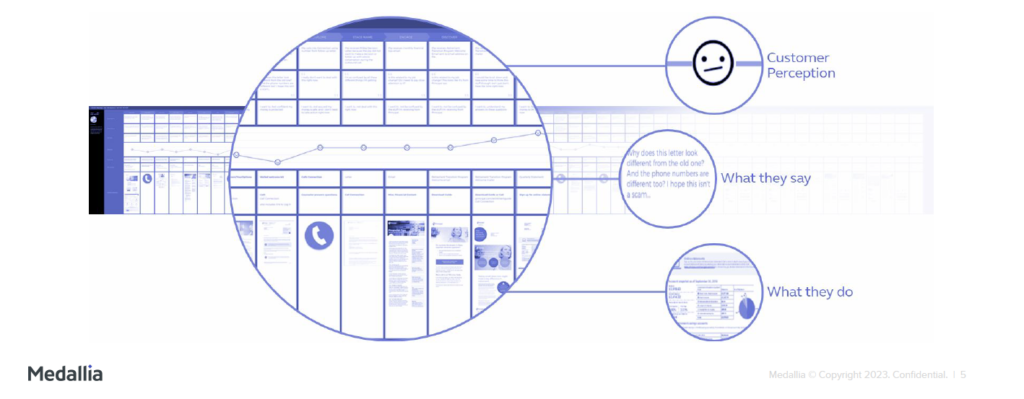
Sometimes there's a tendency to put too much detail into a map. So it’s essential to make sure you're creating the map for a specific audience, not just for yourself or the mapping team. It needs to be a map that communicates insights to other people.
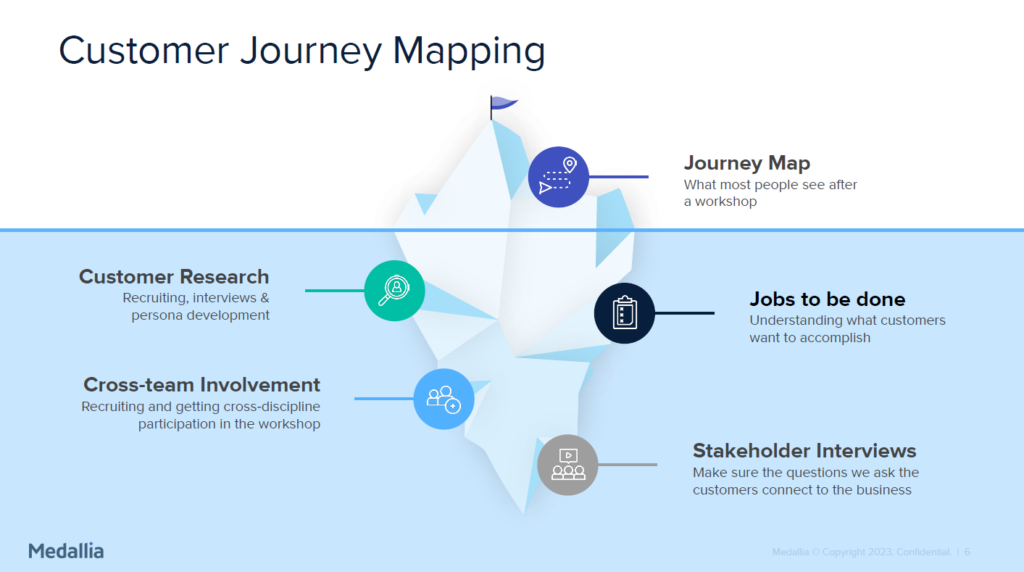
It’s also important to remember and explain to others that a journey map is just the surface of all the different efforts that need to happen before building the map or facilitating a mapping workshop.
Another key thing about journeys is that they may get blurred when they're not about one persona with one scenario and don’t tell a clear story. If we're talking about people in general or segments of people in general, the journeys can get slightly lost, ultimately breaking down the effectiveness of what you are trying to communicate.
“Journey maps must focus on one persona within one scenario to tell a clear story.”
Common reasons why journey maps fail
There can be different reasons why a map doesn’t deliver the expected results:
- Not doing your homework;
- Not focusing on the right goal;
- Having the wrong perspective;
- Insufficient detail;
- Leaving out the “detractors”;
- Not attached to a defined business problem;
- Ineffective follow-up action;
- It’s treated as a project;
- Not including the right participants;
- Insufficient scope definition (too broad, too narrow, etc.).
Making sure you avoid falling into these traps of having a journey that fails must be part of the prioritization process.
Prioritizing journeys
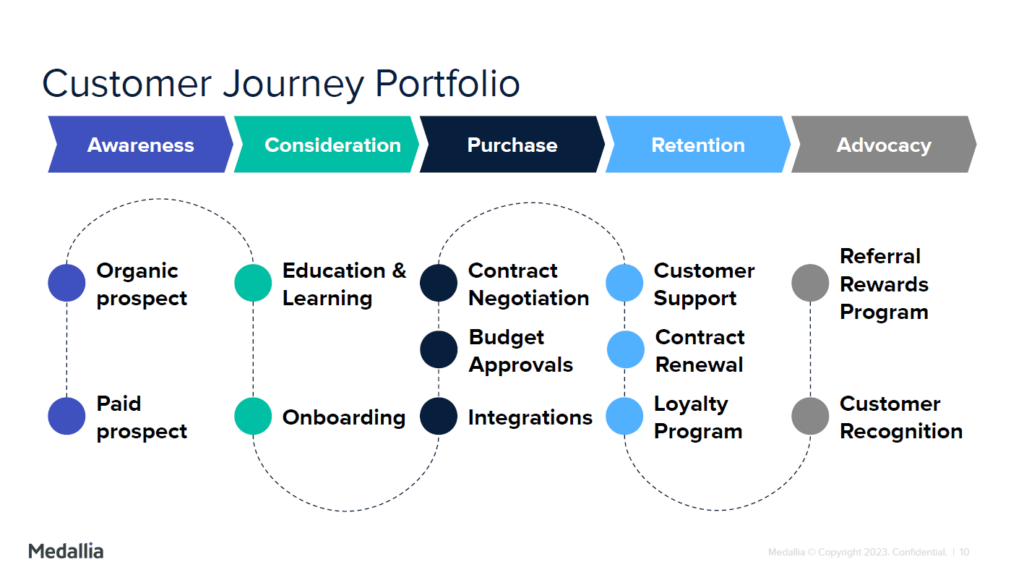
One of the best practices when you're thinking about journey maps and how to approach your journeys is thinking about your customer life cycle and a journey portfolio.
You don't have to map every single one of these journeys, but you could try to say: ”Okay, what are some key journeys that may happen, for example, in the awareness phase or the consideration phase?”
A best practice is to use a holistic approach involving consideration of all types of journeys and key journeys that might occur. The journeys that impact the business or have an impact on operations. To get an idea and sense of your journey portfolio, ask yourself what key journeys a customer might take along the way?
If you start with one or two journeys, that's Okay. But from a strategy perspective, it’s a bright idea to take a step back and do a brainstorming exercise with your team or colleagues to try to understand what your portfolio should include.
And then the new questions will arise: “What to do next? Which journey should we focus on?”
A journey to focus on
There’s a great quote from Dr. Maxie Schmidt of Forrester Research on the importance of picking the right journeys to achieve success.
That’s what Keith has seen countless times when mentioning journey maps to a client or a business. That skepticism tells him right away that either the wrong journeys were picked or the journeys were somehow developed or communicated in the wrong way.
“When you're picking the right journeys, you can't say that you’re going to map the whole universe. You're not going to try to go too big. Instead, you are going to map just the solar system, something that is within reach.”
There can be different approaches to prioritizing journeys (see the one by Forrester, for example). Keith uses his own prioritization methodology based on the human-centered design (HCD) approach.
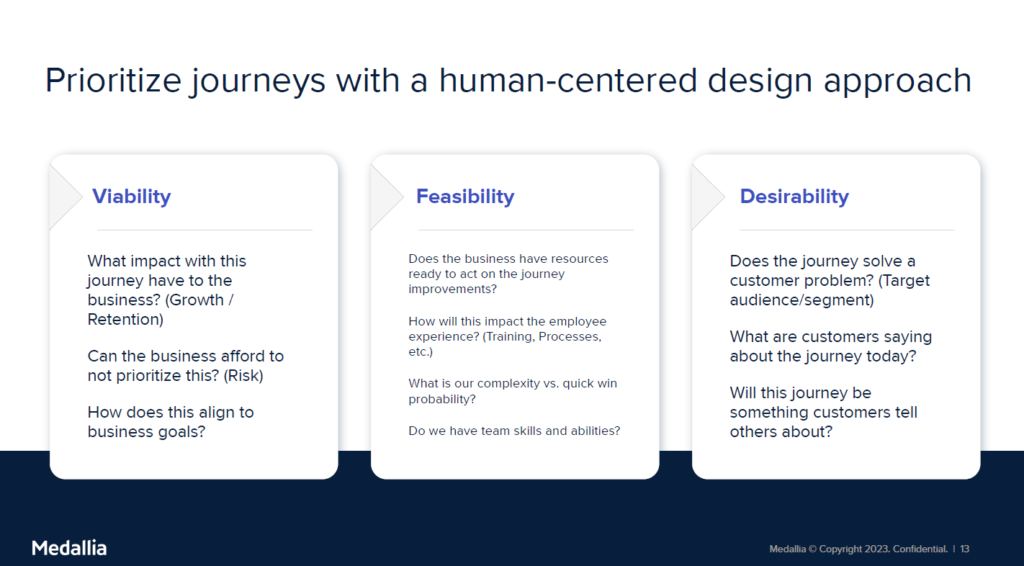
Viability
If you are familiar with HCD, it may seem that the prioritization order is wrong. But when it comes to journey mapping, it makes sense to reorder things and start with the impact the journey will have on the business and how it is connected to business strategy and outcomes. Ask yourself: “If a customer goes through this, is it about acquiring a customer? Is it about retaining a customer? How does that impact the business part?”
There are more crucial questions to answer:
- Can the business afford not to prioritize this journey? It’s about a risk that's happening if you don't understand this journey.
- Is there a business risk that we could be avoiding and preventing? That also can contribute to your ROI of CX.
In the end, you could say: “Hey, we took a proactive approach, we understood this journey, and we made changes before we had this risk happen to the business. And this is how much money we avoided potentially having hit our operations or the call center.”
Feasibility
The next step is looking at prioritizing around the feasibility and answering the four questions:
- Does the business have resources ready to act on the journey improvements?
- How will this impact the employee experience? (Training, Processes, etc.)
- What is our complexity vs. quick win probability?
- Do we have team skills and abilities?
We need to think about the overall impact and effort there. Are we looking for quick win journeys or are we Okay with going more complex?
Sometimes, if we are getting started, we need a quick win. It makes sense to give the most attention to a smaller journey, a little bit more manageable one, to show the value of doing that work.
Desirability
This is where these three questions come into play:
- Does the journey solve a customer problem?
- What are customers saying about the journey today? For example, you can use VoC signals and insights to understand more about where your customers are at.
- Will this journey be something customers tell others about? It’s about delightful moments making this journey a differentiator for the business and customers.
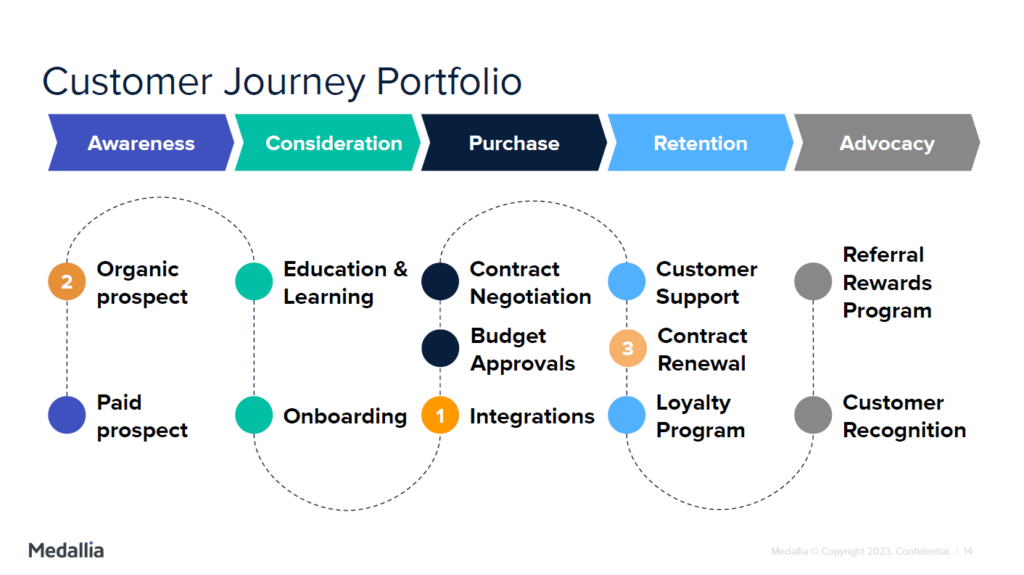
Referring back to the Customer Journey Portfolio above, if we considered our business strategy and viability, feasibility, and desirability, what we are hearing the most and understand from the business perspective, we would prioritize journeys the following way:

The Integrations would be first, Organic Prospect would be second, and Contract Renewal would be third. So we would pick two or three journeys to concentrate on and become part of a roadmap.
Before we dive into that, let’s talk about measurement and journey analytics.
Journey analytics
Journey analytics is understanding how customer behaviors impact business outcomes by measuring and analyzing key customer journeys, not just individual touchpoints.
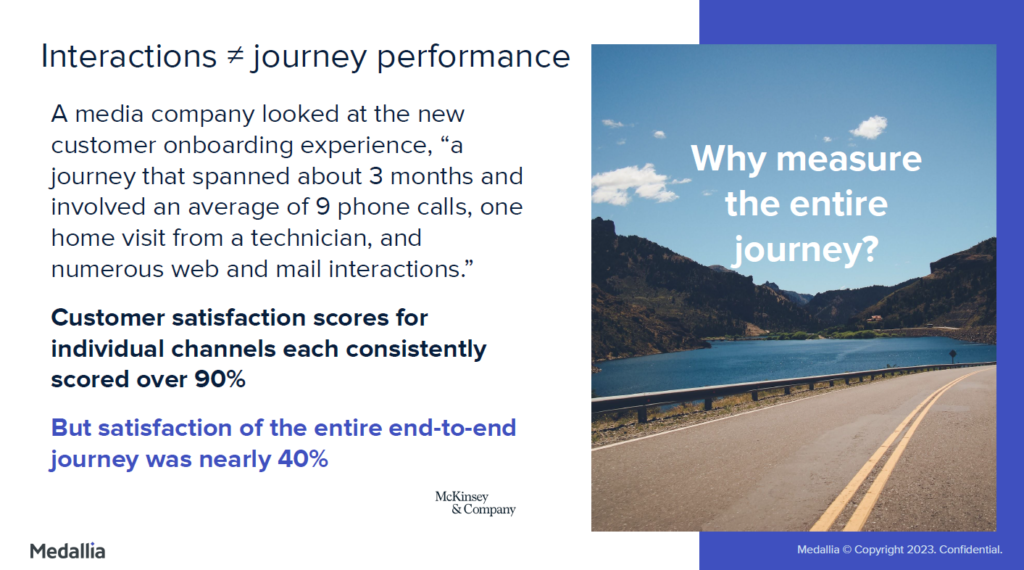
An example from McKinsey & Company illustrates that the sum of interactions does not equal how your journey is performing. At every point along the interactions, everybody in their silo works hard to get a good customer satisfaction score and improve their channel. But if we do a relationship survey, we will see that the end-to-end journey has a low satisfaction rating.
And there’s a logical reason for that: the customer didn't want nine phone calls, they didn't want multiple email and web interactions. They might have just needed the technician and maybe one or two communications, but not all those interactions.
That brings us to the importance of understanding why we will measure the entire journey and why to think about journey analytics and journey performance rather than just the channels because the sum of those interactions doesn't always equal how the customer views the journey performance for them.
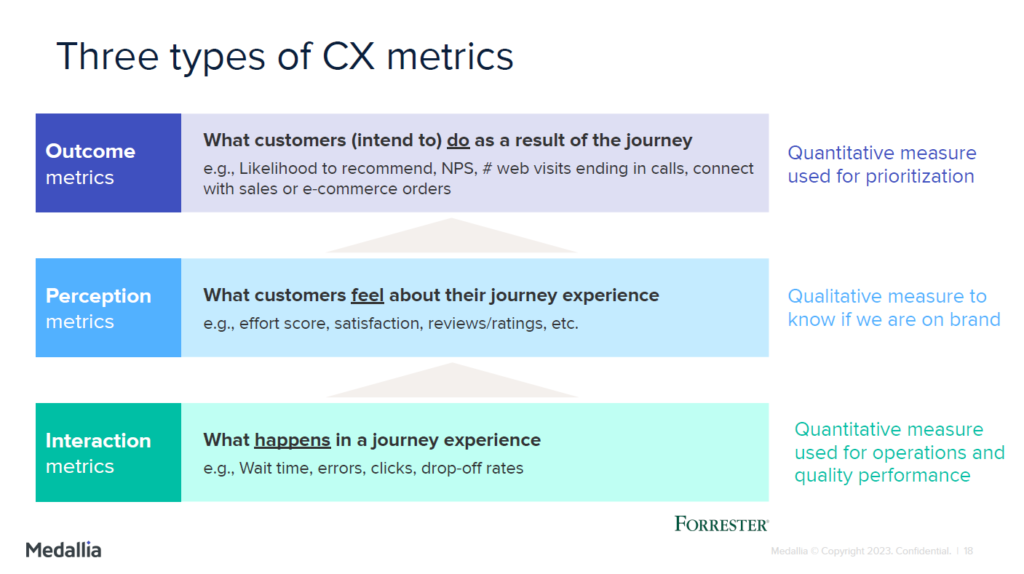
In his work, Keith uses three types of CX metrics:
- Outcome metrics. The outcome is closer to the journey.
- Perception metrics. How are customers feeling about it? What happens along the way?
- Interaction metrics. These metrics should be used in orchestration when we're thinking about how to measure the journey.
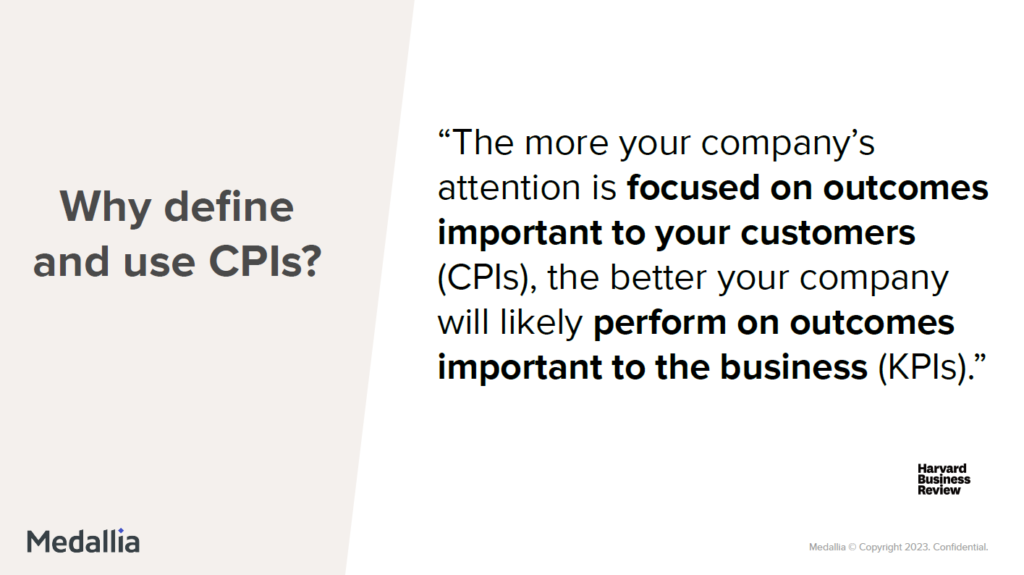
There is one more approach to measurement from Harvard Business Review.
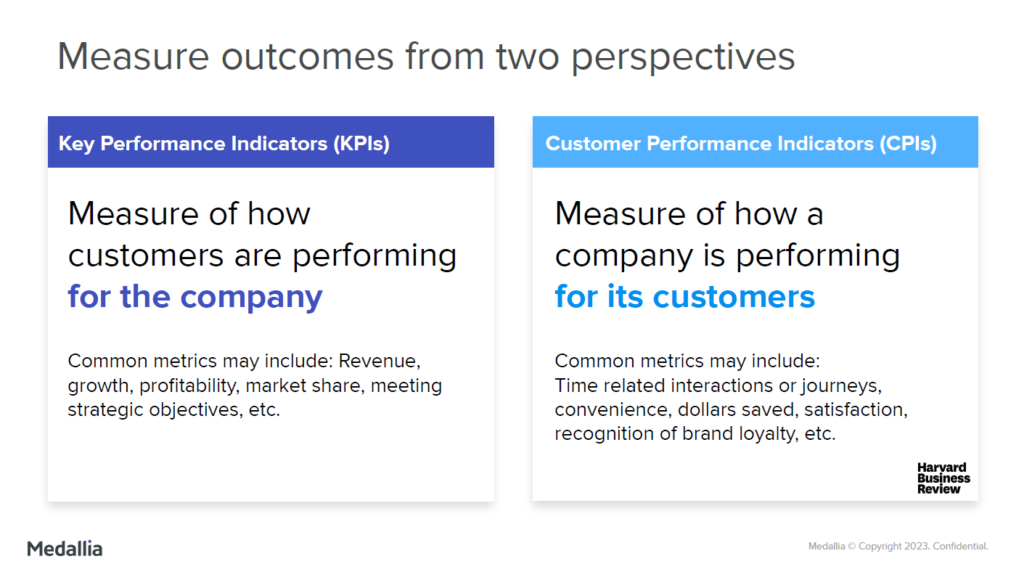
When we are working with journeys and talking to our business partners about customer experience, we are focused on measuring how the customers are performing for the company. But it’s also essential to shift this focus and use customer performance indicators and measure “how are we as a company performing for the customer?”
A map example walkthrough
Keith adapted the map below to share during his presentation. It is based on the actual map created for a client and visualizes an online extra loan payment journey.
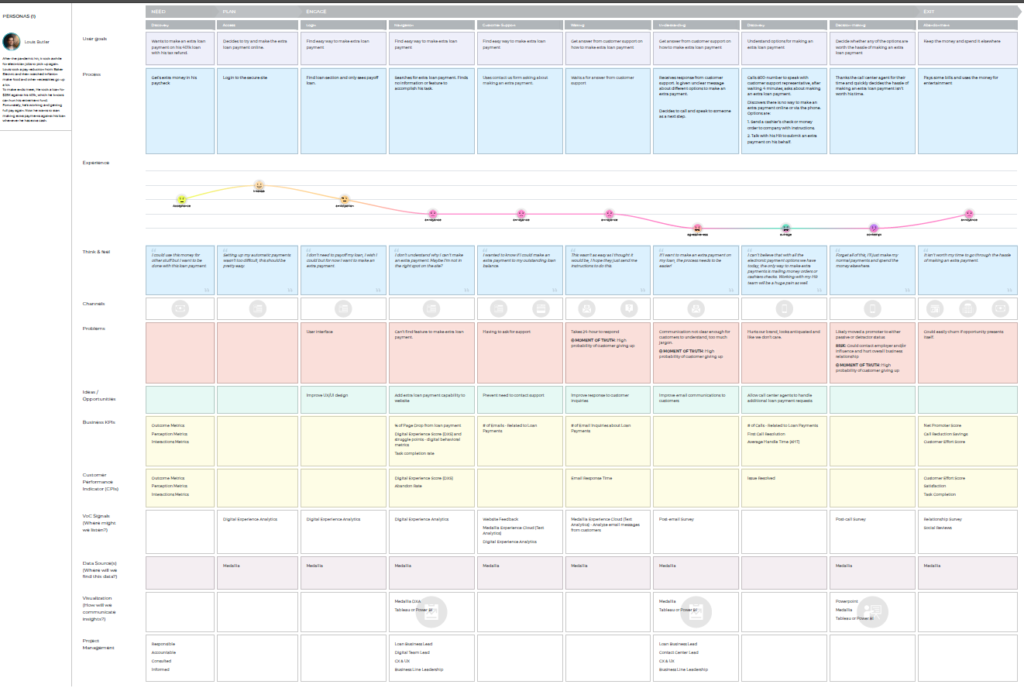
This map includes common map sections (user goals, process, experience, think & feel, channels, problems, ideas/opportunities) and metrics-related ones.
An overview of the persona and case
This map is about the journey of one persona called Louis Butler. Louis is an electrician by trade. During the pandemic, he had some hard times and time off work.
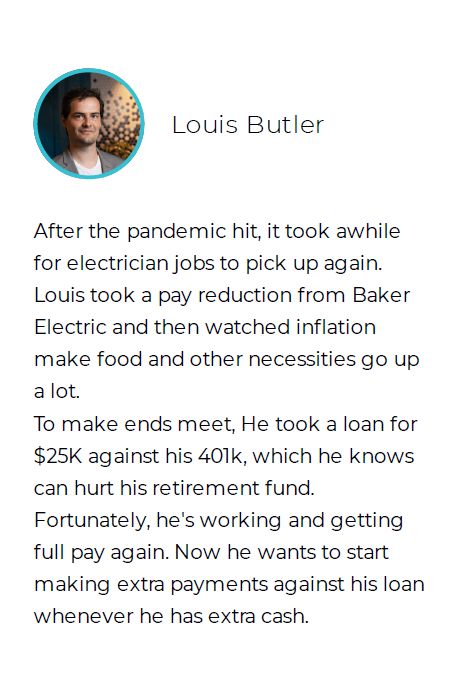
In this particular case, Louis needed to pay the bills and keep things moving. So he found himself in a scenario where he needed to take a loan against his retirement account and then pay that retirement loan back to put his retirement savings back into place. Now he works and wants to start making extra payments against his loan whenever he has extra cash.
An overview of the journey and stages
At the first, NEED stage, Louis’ goal is to make an extra loan payment. So he goes to a website, logs into it (the PLAN stage), and proceeds to the ENGAGE stage.
The ENGAGE stage is a large one as it consists of seven substages:
- Login. Louis finds the loan section and only sees a payoff loan.
- Navigation. He tries to find out how to make the extra loan payment. But it turns out that it’s no easy way to do that: Louis cannot find a dedicated website section, though he expected the feature to be there.
- Customer Support. Louis uses the ‘Contact us’ form to get an answer from customer support on how to make the loan payment.
- Waiting. He waits for an answer from customer support for 24 hours. We’ve got the first Moment of Truth here (you can see more of them on the map).
“If somebody has struggled this much on the website already, the likelihood that they reach out to contact us is low. And there's a likelihood that we've lost. There's a probability that the customer has given up at this point and just went away. That moment of truth is a point where we are embellishing and saying that Louis might go a little bit further (and some people do this). That's why we were able to know this would be the next step. But it’s crucial to remember that it's the minority of people that would take this next step.”
- Understanding. The email Louis gets is confusing. And that’s another Moment of Truth as he is in two minds about whether to continue trying.
- Discovery. Being pushed forward, Louis calls the contact center. The agent informs him there's no way to do what Louis wants through the website. There are only two options: ask his HR people to submit an extra payment on his behalf or send a cashier's check or money order to the company with instructions.
- Decision-making. Louis takes it along. He decides that it's just too much effort, it's too hard to proceed.
And here we are, at the last, EXIT stage. Louis pays some other bills and uses the money for entertainment. Unfortunately, this journey has no happy ending.
If we take a high-level look at the journey, we will see many opportunities to improve. We have lots of Moments of Truth, lots of risks, and lots of ways we could be doing things differently for Louis. One would be adding the feature to allow him to make extra payments on his loan on the website and avoid all the other accompanying pieces.
The metrics part of the map incorporates the following sections:
- Business KPIs;
- CPIs;
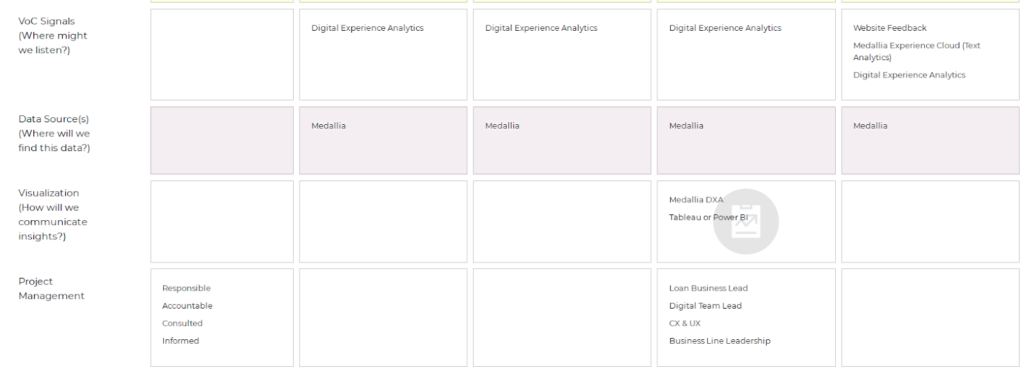
- VoC signals;
- Data sources;
- Visualization;
- Project management.
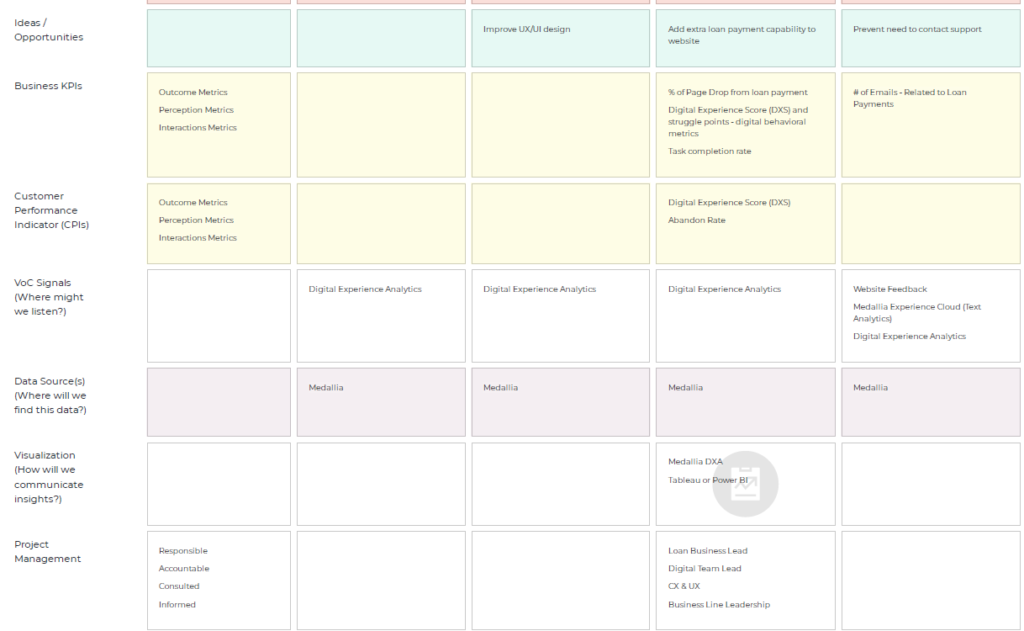
The first section is business KPIs. And this is how the business is performing for the customer. Keith likes to use this approach in his journey mapping to talk through it. People like to have this great aha moment when they say: “I know how I would measure this!”
Sometimes when doing a journey mapping exercise, it’s better to go back and ask ourselves how we would measure these moments along the way. And then we even ask things like where our signals would be.
For example, Medallia, where Keith works, has a framework of signals to action related to where you could listen or where you might be monitoring or analyzing data to understand what the customer is experiencing there.
Other metrics-related sections cover where to get the data (the Data sources section), where it is located (the Project management section), and how to visualize the data (the Visualization section) to democratize it so that more than just the insights team sees it.
Keith always thinks holistically about his journeys, about breaking them down as he gets into the measurement.
Let’s delve into measurement opportunities at, for example, the Navigation substage. In the Business KPIs section, there are three metrics:
- % of Page Drop from loan payment;
- Digital Experience Score (DXS) and struggle points;
- Task completion rate.
Keith picked these metrics as there are certainly moments where we could look for the drop-offs from the loan payment. We could also measure a digital experience score (DXS) with Medallia and look at the task completion rate (Are people finishing other tasks in that experience?).
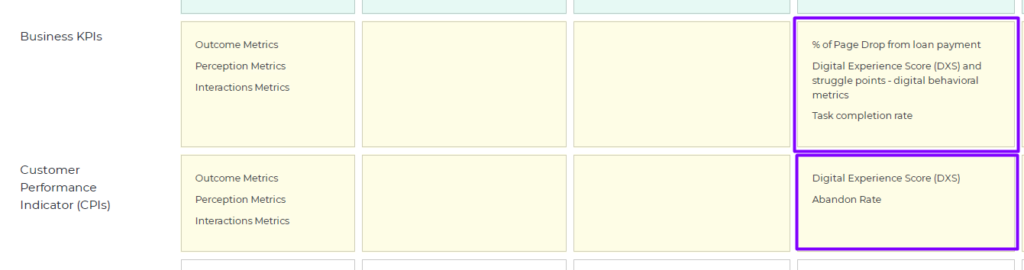
As for CPIs, the abandonment rate would be a key thing for how the company's performing for the customer. The DXS score is also in this section, as business KPIs and CPIs can coexist, and sometimes they apply to both metrics. They are measuring both how the customer is performing for the company and tell the story of how the company is performing for the customer.
That gives you a clear idea of the key metrics you should concentrate on. It helps you prioritize. If it’s not obvious how to measure the abandonment rate since it's both a KPI and a CPI. That tells us we need to focus on that as it’s a key metric.
In journey mapping, it’s common to identify metrics that aren't easy to measure today. Like how many calls we're getting and how many people are talking about this. And if there's no easy way to get that, make sure it will be on a roadmap of how you get to that metric.
It’s also essential to have other metrics along the way. So when mapping out a journey or guiding others through journey mapping and identifying the metrics, Keith follows the same strategy: no holds barred.
“Don’t stop yourself. Make sure you keep your design thinking caps on. What metrics would you like to have? What are the key metrics for both KPIs and CPIs?”
Later, there will be a reality check when you determine where to find VoC signals, how to capture them, where to get the data, and where to visualize it. Sometimes you'll have to deal with getting the data out as though you are capturing it, but accessing it isn't easy. Talking through that helps you understand what metrics you will be able to report on across this specific journey.
In his example, Keith listed many different things in Business KPIs and CPIs sections. Some CPIs may seem to be KPIs, but they are not. For example, the Issue Resolution metrics. It’s about how the company is performing for the customer, it’s very customer-focused.

Alternatively, the Customer Effort Score applies to both as it would be something we definitely would want to measure to know if both the company and the customer are performing well in this journey.
Measuring a journey performance
Journey performance is a sum of two elements:
- Interactions that predict journey performance success;
- end-of-journey outcomes and metrics.
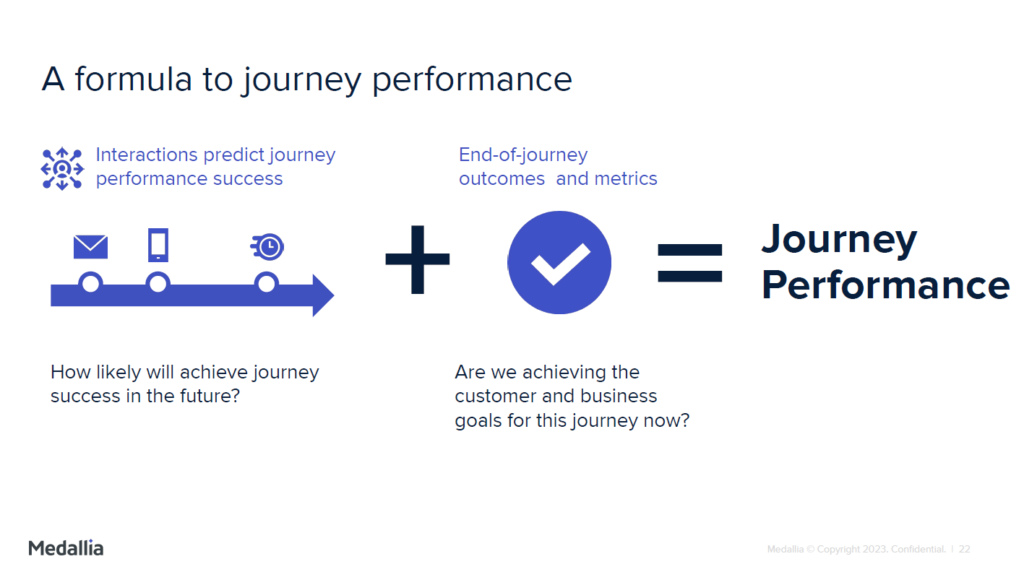
How to quantify or put a performance rating on our journeys? Keith loves using the example below as it’s a notion, an idea that is easy to communicate.
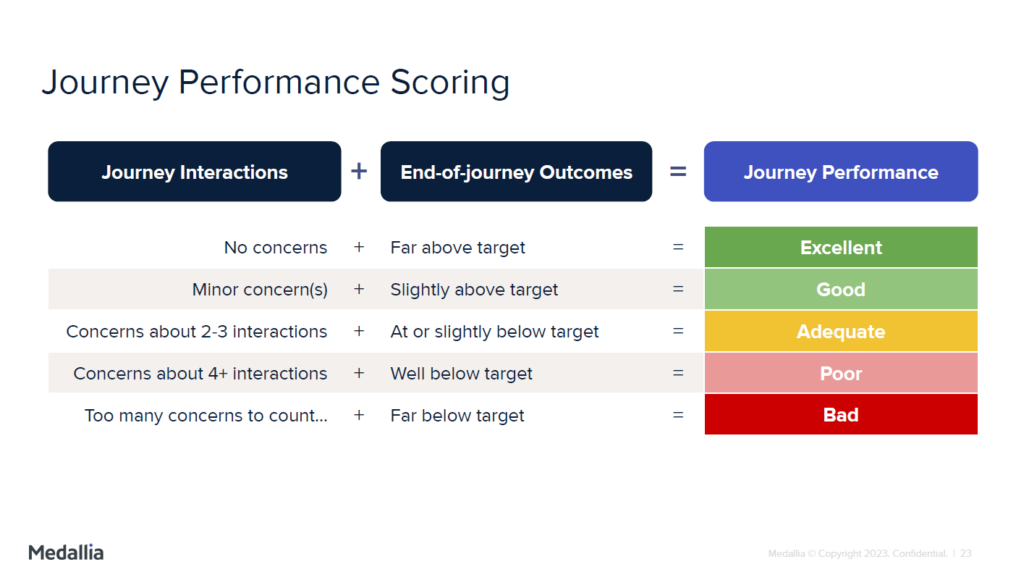
How does it work? For example, you have a bunch of interactions along your journey, don't see much struggle, and don't have any concerns. You also see that after a customer goes through this journey, both the customer and the business get what they want, then the journey performance is excellent.
If you prioritize and see two or three concerns and see you're not quite at target for your outcome metrics, it might be an adequate performing journey. But you might have other poor or bad journeys to take care of.
Let’s get back to the Customer Journey Portfolio example and find out how measuring the customer journey performance could impact prioritization.
We have three journeys we have decided to focus on:
Let’s flip things a little bit and use the journey performance. Imagine that after mapping out these journeys we discovered that number one has a poor experience, but number three was actually the worst experience for the customers and the business.
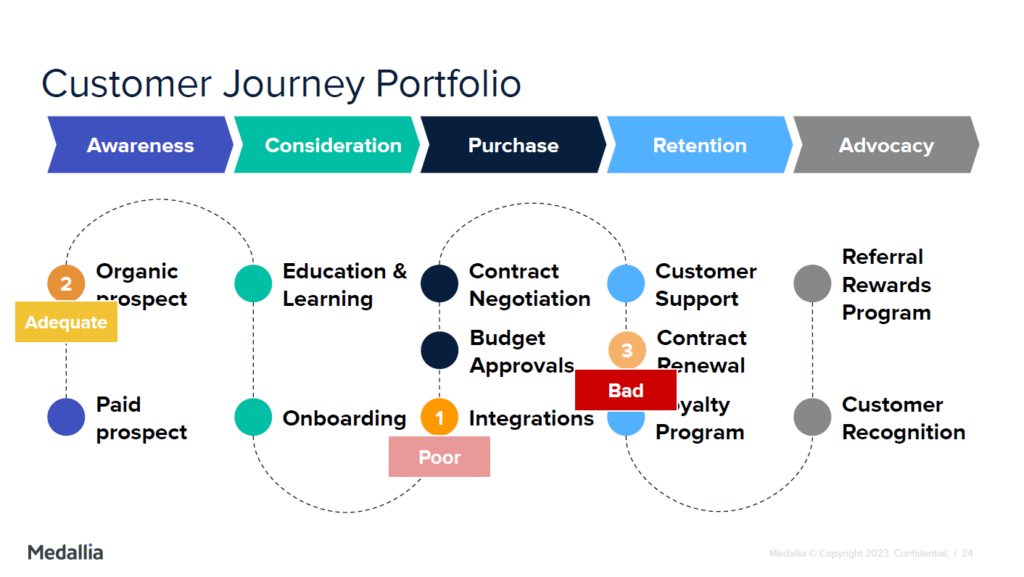
That customer journey performance now gives us another way of adjusting our prioritization, making Contract Renewal number one and Integrations number two. If we have resources, we can work on these two in parallel.
When we look at Organic Prospect, where performance is adequate, we need to decide whether this performance is good enough. So ask yourself: “Do we need to have it on our roadmap now?”
Final thoughts
There are lots of ways to prioritize what journeys to start with. For example, you can leverage the Forrester framework or take advantage of the inverted, human-centered design framework to prioritize and then use journey performance to decide which journeys you will act on next. These two frameworks together will help you align on the best way to use your journeys.
Mapping out the metrics to monitor and report on is also vital for understanding how to move from poor customer journey performance to good or excellent one. Having that on your journey map is crucial, as without them, there will be a substantial gap in your journey map layers and, consequently, your journey portfolio.
Connecting your journeys to your business is a challenging task, and different professional tools like Medallia can help you monitor customer journeys, measure customer behavior, and so on.
Bonus: the recording
Watch the recording of the session with Keith to learn everything about measuring customer journey performance. Be sure not to skip the Q&A part, where the speaker talks about measuring customer satisfaction, introducing the CPIs idea to the management, the best way to pick the right journey, and more.