This article is based on the talk by Tiziana d'Agostino, where she covered one of the recent projects — an overhaul of the website aimed at improving UX and driving generating more sales through it.
It’s nearly impossible to create a perfect product—delightful for users, successful from the business perspective, and technically feasible—from scratch. Even if you seem to have one, make sure to regularly check whether it works as expected and delivers the proper experience, and make necessary tweaks if needed.
This is exactly what a San Diego nonprofit organization did last year for their language school website. Realizing they had a problem with the enrollment flow on the site, they sought external help from Tiziana d'Agostino, UX Psychology and Interaction Design Consultant, and made the right call.
Keep on reading to learn how Tiziana used design thinking and empathy to improve the user flow and what role a journey map played in convincing the client to overhaul the enrollment process.
Contents
- 1 An outdated website as a stumbling block to effective sales
- 2 Turning raw data into the actual knowledge
- 3 Bringing attention to the problem with journey mapping
- 4 Visualizing the as-is Rosie’s journey
- 5 Explaining what’s wrong visually
- 6 Onward to a better flow with the to-be journey map
- 7 Summing up
- 8 Q&A session
- 9 The recording
- 10 About the author
An outdated website as a stumbling block to effective sales
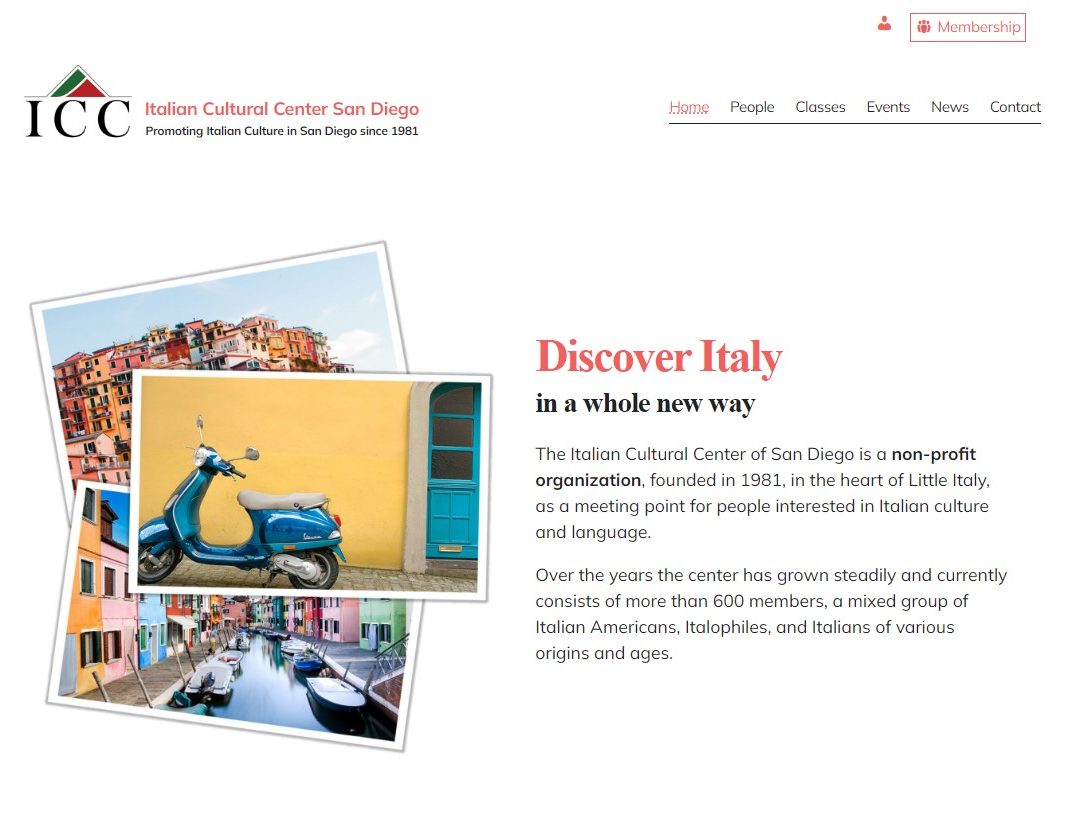
The nonprofit organization positioned their language school in the heart of Little Italy in San Diego as a perfect meeting point for people interested in Italian culture and Italian language events. They wanted to get a constantly high student flow through the website, as their survival as a nonprofit depended on the language classes. But it didn't work as well as they needed it to. Not only was the site outdated, but there were usability issues. These issues were the fault of limited user research and the usability testing that wasn’t done for the site.
On top of that, the school used Google Analytics to understand their audience, which measures things like how many people come to a site and at what point they leave it, while it doesn’t explain the reasons behind these people’s actions. As a result, such crucial questions as why visitors were leaving without purchasing a class remained unanswered.
Turning raw data into the actual knowledge
Tiziana started with a survey to learn more about students taking Italian classes. While doing it, she found out that though the nonprofit had a lot of user data on hand, they never went through it and had no idea who their customers were.
For instance, it soon became clear that the average student was over 60, while the client was sure that this was someone middle-aged or even younger.
“That kind of information that you would think is basic, but the client did not have at all.”
The next step was validating her data by interviewing some students who took the survey. And they confirmed that the school website wasn’t that friendly and easy to use—it was pretty hard to find the information they wanted.
Tiziana put the data into use by creating user personas (three in total) that represented the target audience. She focused on Rosie, who represented the older group of students.
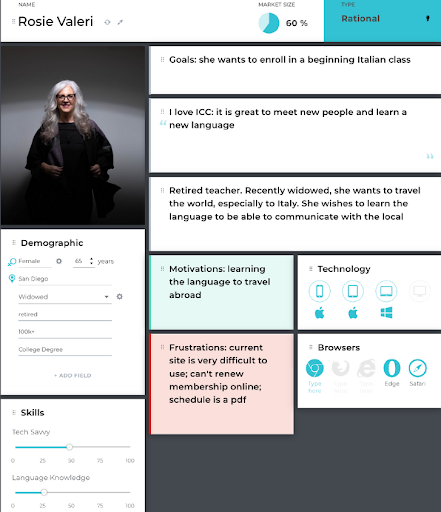
Rosie was a female about 65 years old from San Diego with a college degree. Having little knowledge of the Italian language, the persona chose the beginning classes and was very motivated, sometimes because of an upcoming trip. Rosie wasn’t very tech-savvy: she wasn’t always on the phone or checking out apps. So the maze-like website navigation was a real headache for her.
Then Tiziana took a mile in Rosie’s shoes by doing the most business-critical task on the website—enrolling in a class. By following Rosie’s path on the site, she experienced the non-smooth enrollment flow herself. In the best-case scenario, it would take about twelve or thirteen steps to enroll, while in the worst-case scenario, the personas would take up to eighteen steps. So obviously that was not a good flow.
Bringing attention to the problem with journey mapping
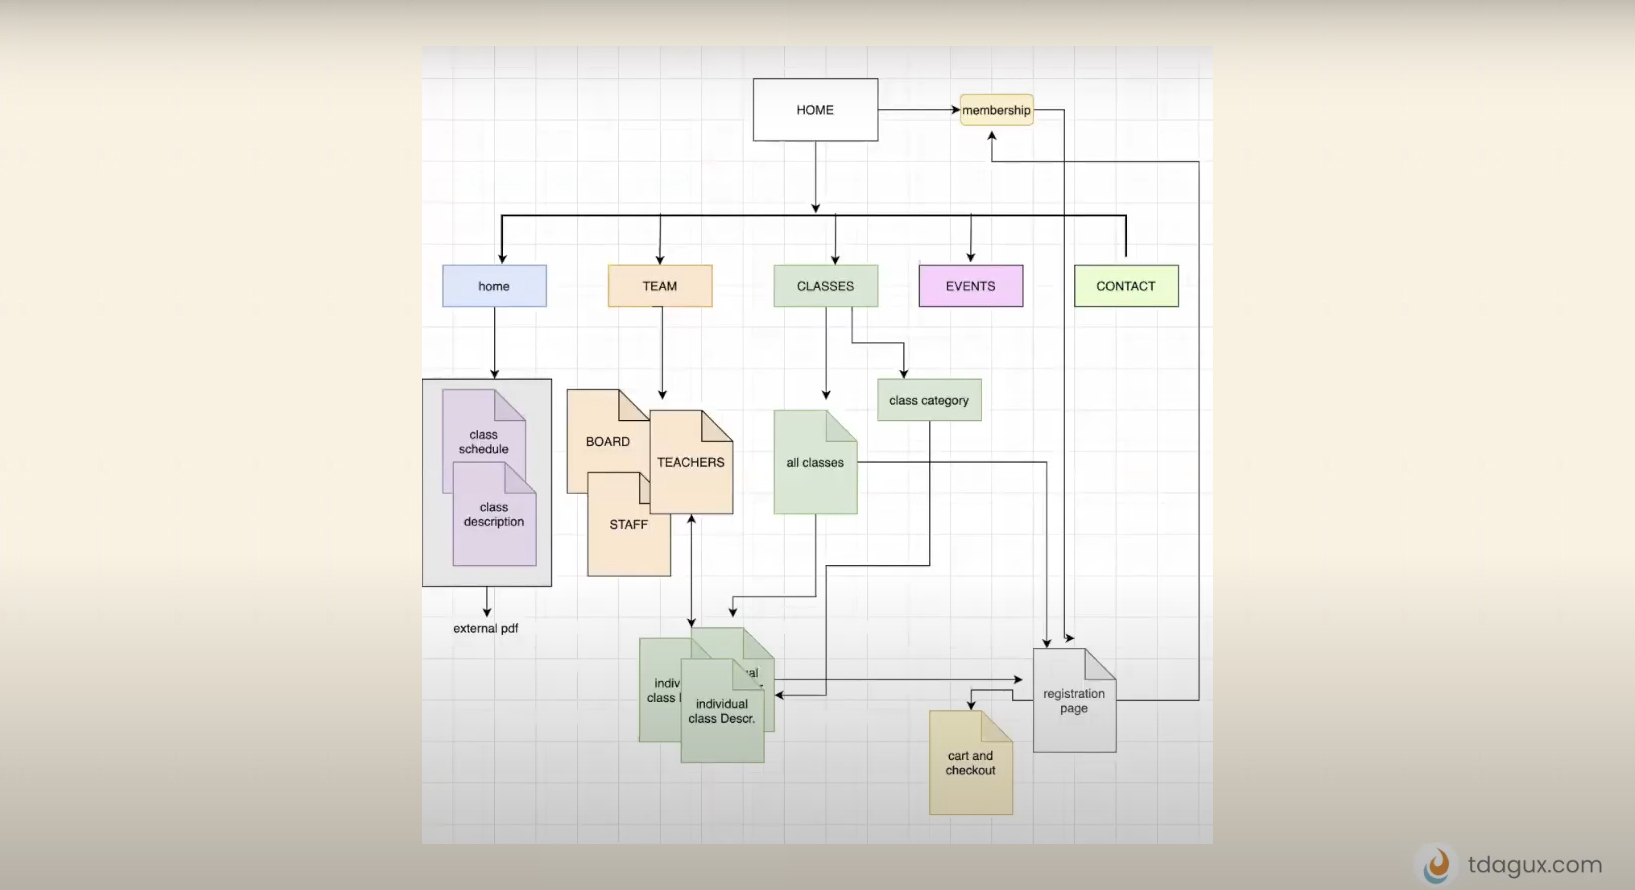
As a UX designer, Tiziana first visualized the enrollment process in a proven way—with a screen flow diagram.
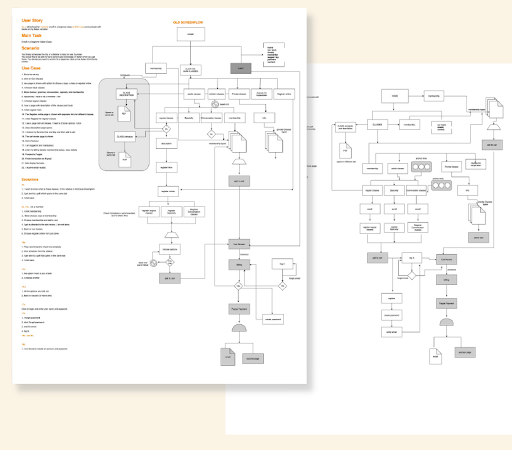
As such a representation is too complicated for people with no UX background, Tiziana needed to turn the spotlight on the usability problem and make it easy to grasp at a glance. That is why she transformed the scheme into a journey map.
“A journey map can come to the rescue when you see that there is a big problem, but it may be a bit difficult to show the client where the problem is. Not because the clients are not smart enough, but they are just so involved with their project that they can’t see the problems.”
Being backed up with real data, a journey map is a great visual tool that can help you explain the current state of the user journey, their experience with an organization, and evoke empathy by making it really obvious where the problem is and users’ emotions about it. This all makes it times easier to get the client’s buy-in and convince them to make necessary changes. And these changes can sometimes be huge, like doing a complete overhaul of the site, which Tiziana did for her client.
Expert tip from Tiziana
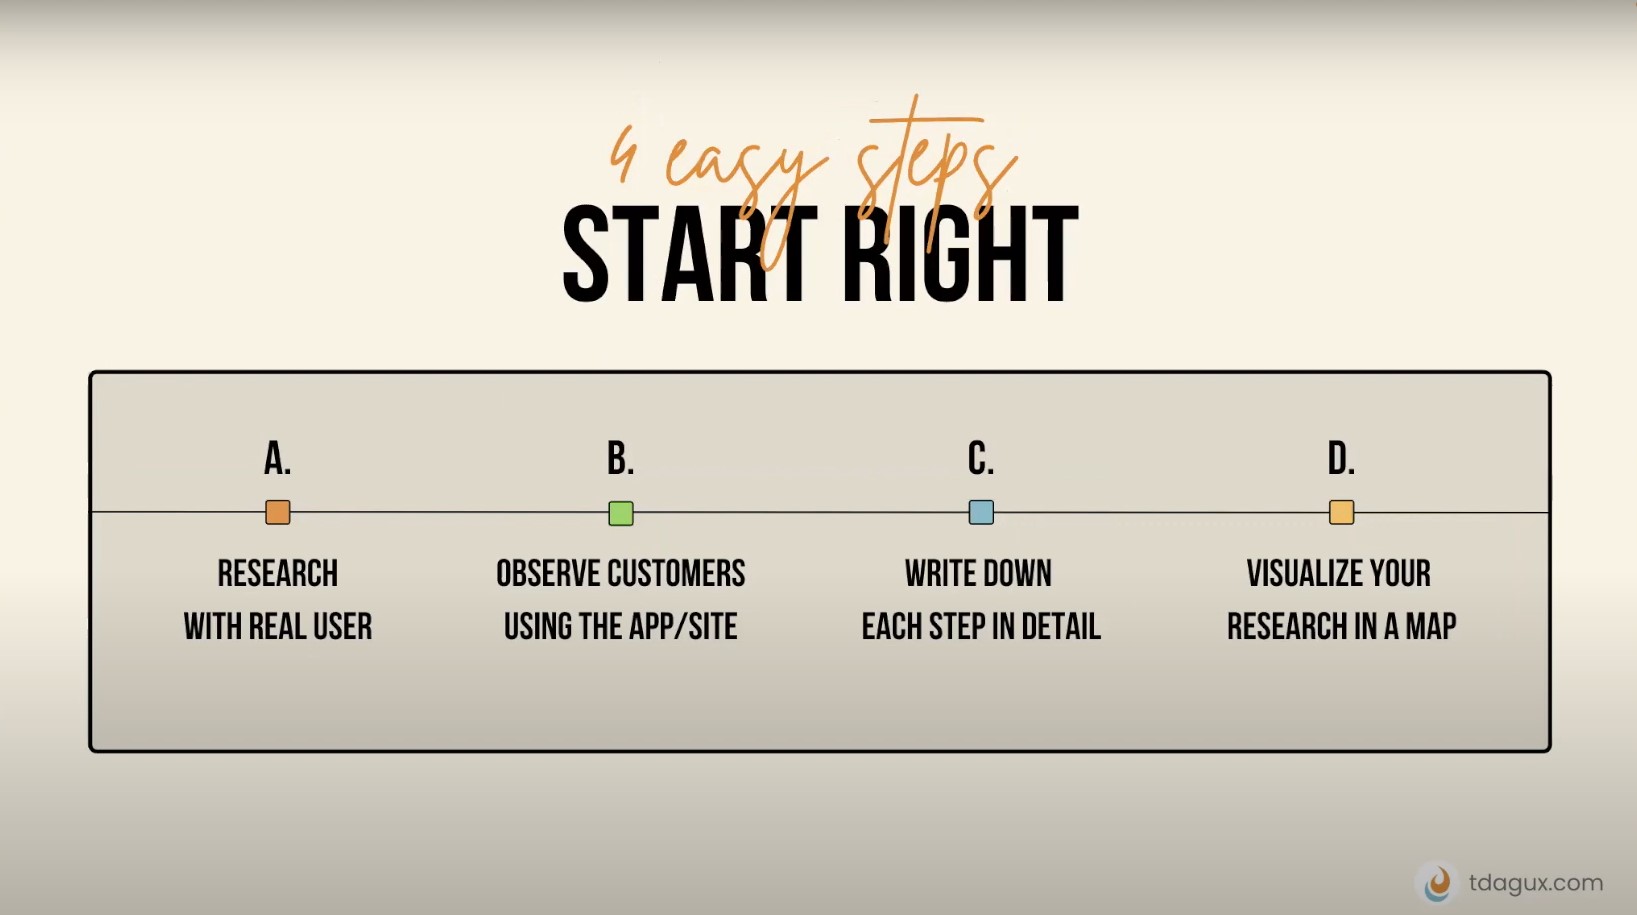
To create a good journey map, the one that actually will work, you need to:
- Talk to your real customers and have them actually use the site.
- Add depth, identifying not only the steps your customers take, but also the emotions they experience at each of these steps.
- Add visuals like screenshots to show where the problem is.
Journey mapping is a journey itself
The mapping process is the last, fourth, step of the mapping journey. Before you visualize the persona's journey, there are three previous steps to take.
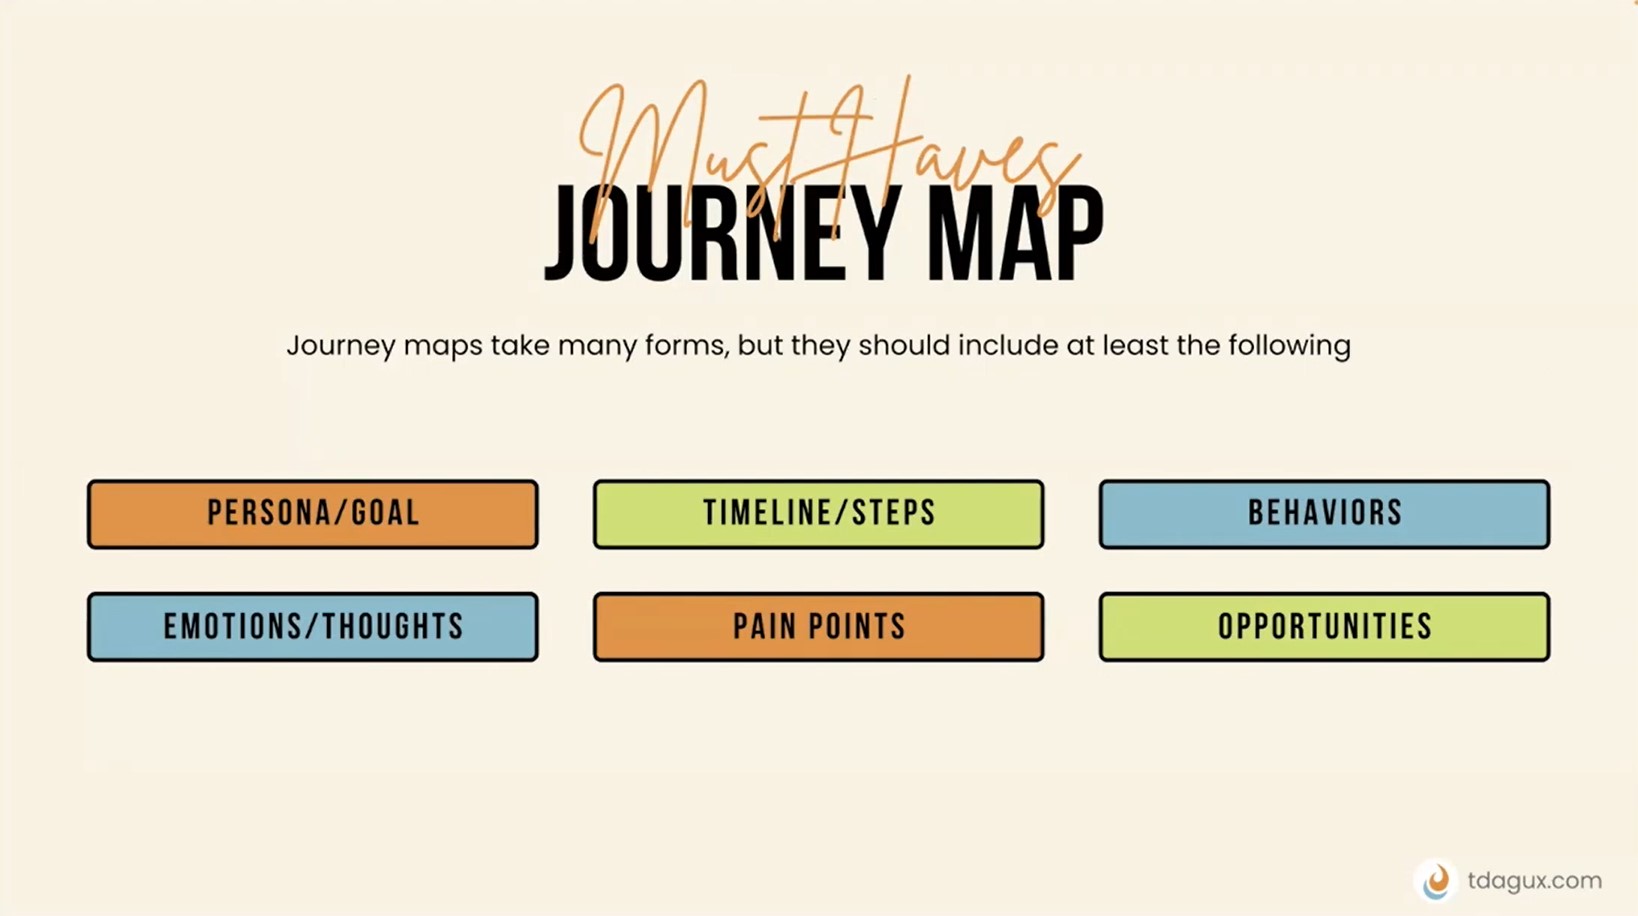
Also, journey maps come in a lot of different forms.
“If you google journey maps, you can see a million different variations, but you notice those six elements that usually are always there.”
These are must-haves sections for any map, so be sure to include them in the one you’ll build one day.
Visualizing the as-is Rosie’s journey
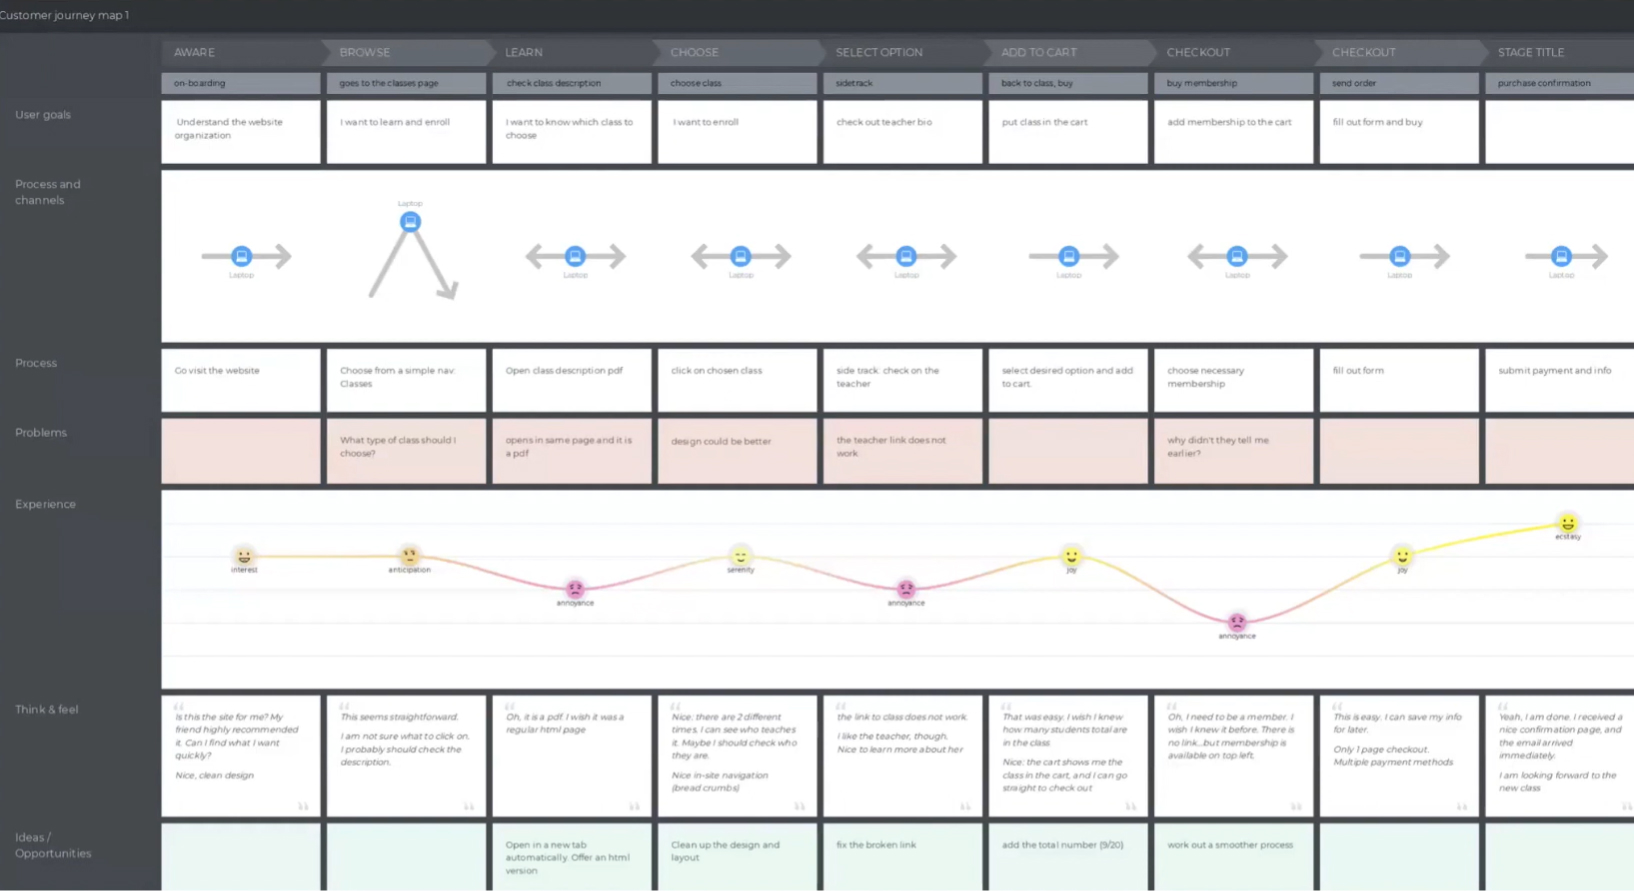
With her map, Tiziana visualized the worst-case scenario by covering Rosie’s seventeen steps on the site.
Besides must-have sections, she added some other sections (e.g., with screenshots to zoom them out during the presentation to the client), making her document even more descriptive and easier to grasp.
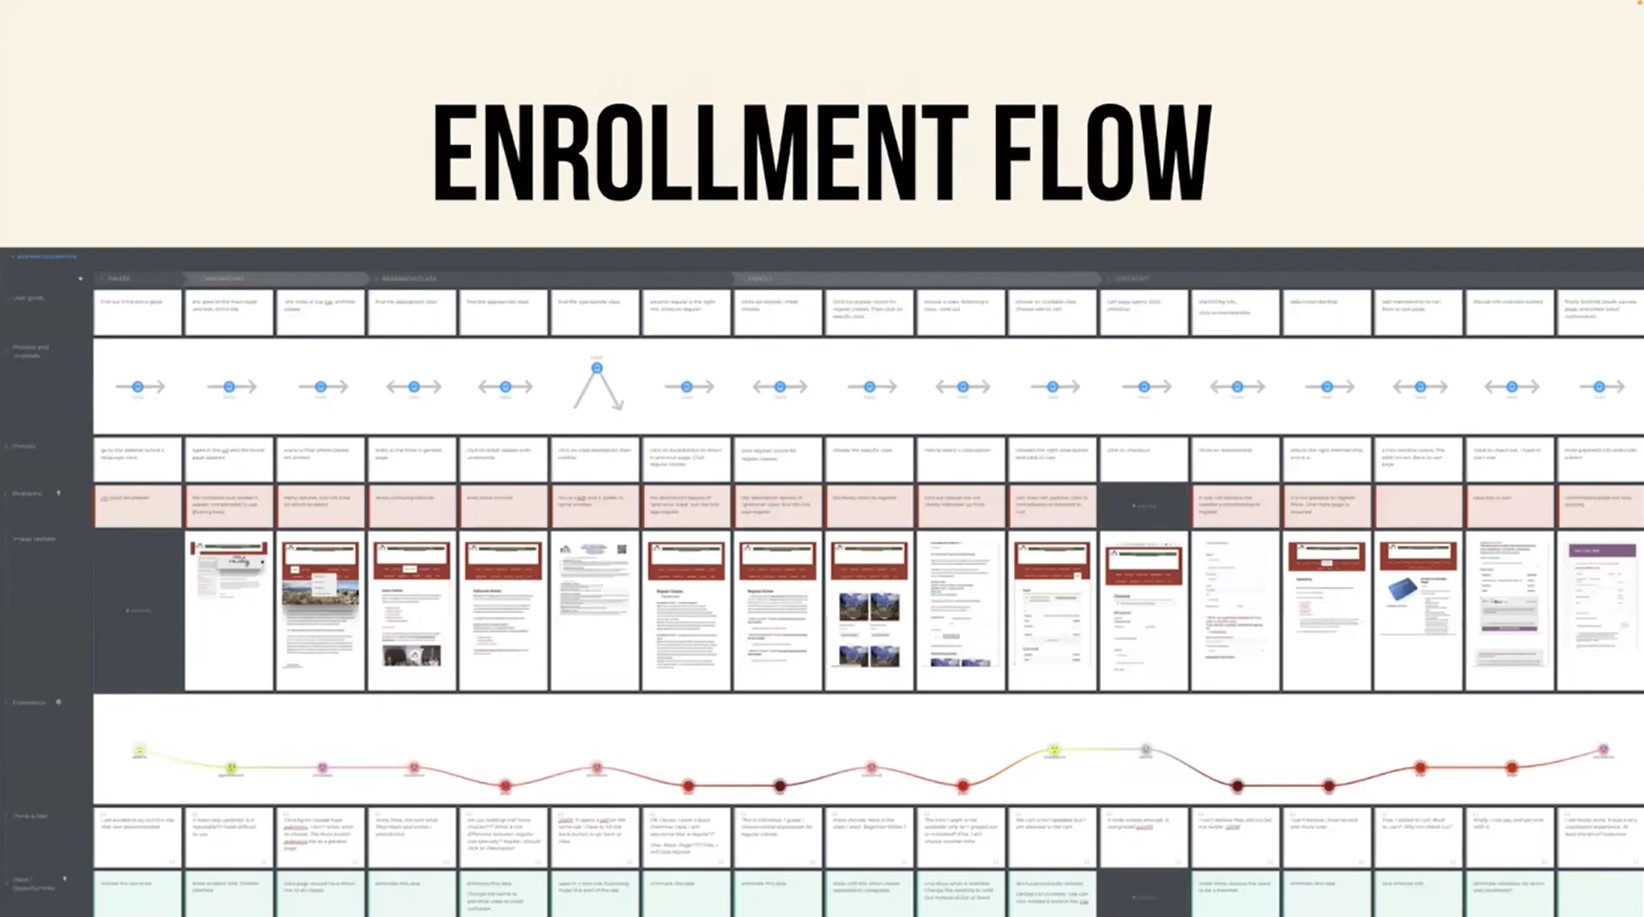
Tiziana also used color-coding to draw the client’s attention to specific document parts. By looking at the map, one can easily tell what the persona does and experiences at each step. For example, there’s a non-linear process when Rosie has to check the classes’ descriptions in the PDF file and then come back to continue with the site.
So Tiziana highlighted the problems Rosie had. It turned out that not every step had one (and it’s perfectly normal). And she identified the areas for improvement for the journey step.
Being a firm believer in the power of emotions, Tiziana used smileys in the experience graph to tell the story of Rosie’s emotional experience.
“I think that the most effective part of a journey map is this line with smiles and emojis, because it tells you immediately how the user was feeling at any moment.”

Explaining what’s wrong visually
To support her presentation with numbers, Tiziana looked at the analytics for three enrollment months to learn that the average bounce rate was 40%, which was pretty bad for such a site.
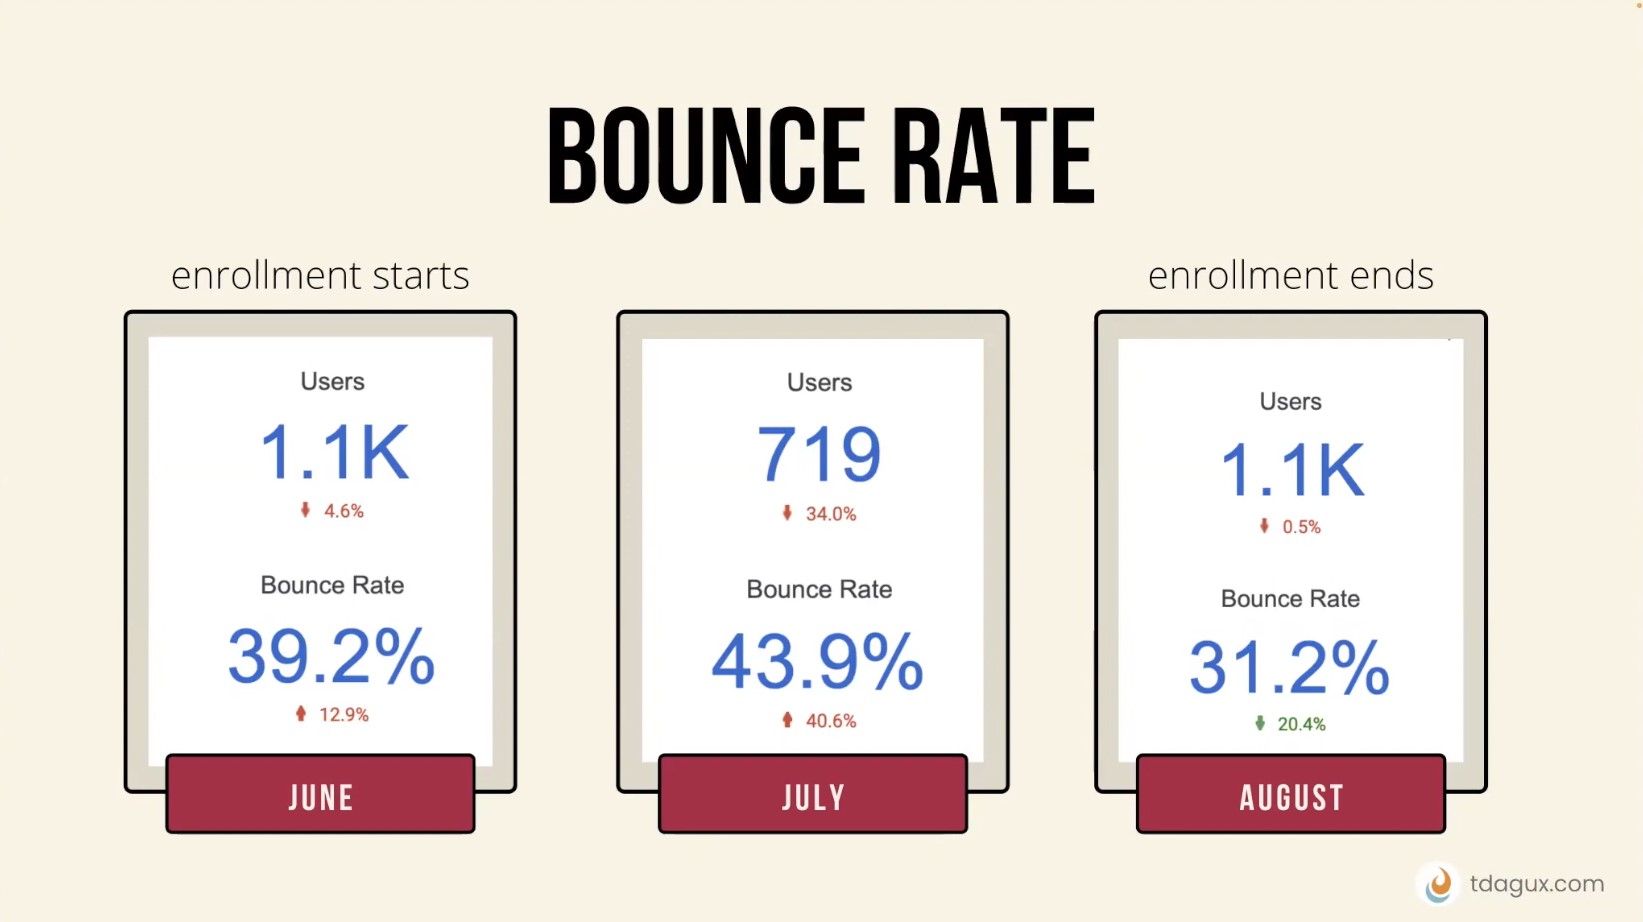
The numbers showed that website users seemed to be discouraged by the whole enrollment process, which led to low sales.
Armed with this information, the journey map, and UX psychology power, Tiziana succeeded in explaining the problem to the client and convincing them they needed a complete overhaul of their site to improve the existing flow.
Onward to a better flow with the to-be journey map
Having the client's consent, Tiziana did some sketching to visualize a better way to organize the website pages and classes. Then she used the sketch to recreate a to-be Rosie's journey in a digital format.
The sketch became a new journey map:
Looking at it, you can see that the negativity level is lower in the new journey compared to the previous one.
Then Tiziana created another version of her map, fixing almost all Rosie’s problems, and this document became the foundation for the new website.

Thanks to the overhaul, the enrollment flow has completely changed, and the website’s user experience has improved. Today, enrolling in a class takes fewer steps.
Summing up
The key idea behind a journey map is to put some visuals in front of the data.
“Most people don't understand data, don't enjoy data. Don't figure out how it works. Especially abstract data. Humans love stories. We love storytelling.”
That’s why Tiziana used journey mapping to show the client what their customers go through and how they feel about it. After that, Tiziana did a great job redesigning the language school's website, cutting the enrollment steps almost in half, and improving the site’s usability. The result is a pleasant, easy-to-use interface that is friendly for current and potential students.
Q&A session
The Q&A session followed Tiziana's talk. Below are some questions and answers to them. Watch the event recording at the end of the article to learn them all.
Can you explain the difference between journey and story mapping?
A story map usually is based more on storytelling. So I see it as a precursor to a journey map with sticky notes and things that help to follow the story arc. With the beginning, an incident that inspires an action, a problem, and its resolution. It helps to position different experiences identified during the testing and cluster those together. Then I organize distinct steps into a journey map.
How to identify persona's emotions without projecting? Or is it more of a guessing game?
I believe that the best user experience professionals have empathy and they're kinda able to connect with people, but they also ask users during usability testing to rate how easy it was. Ideally, a good participant will speak out loud and tell you everything that goes in their head. But if they don't, you may have to pretend you're a therapist. What are you thinking about right now? How does that make you feel? And thus get the information.
Why would you choose this specific technique?
I like to use journey mapping. Actually, there are two different ways I like to use it. One is for the redesign like it was with the language school’s website, which was initially built with no research and testing. The other is creating ideal maps for products that don’t exist yet. In such a case, I map to indicate my potential goals and validate those with user testing. It’s also an excellent technique to get your client on board and make it visual, showing a bunch of smiling or sad faces instead of a diagram they can’t read and understand.
What did you do about other personas of the language school?
I build separate journey maps for each task because I think you need to focus on one thing at a time. Otherwise, there are too many factors to calculate. I know other people may create one global journey map from beginning to end. Let's say it is an app from onboarding to off-boarding all the way through and for each area, then they have what is called sub-maps—smaller journey maps for different tasks. I would map each task individually.
The recording
Sometimes it’s better to see than to read. So watch the recording of our event with Tiziana to find out every tiny detail about the case and learn what other questions she answered during the Q&A session.

Tiziana d’Agostino has over 18 years of experience in the industry. She strives to create the best user experience that will persuade without manipulation. Tiziana earned her Master's in Media Psychology, and she is actively involved in ethical design, inclusion and human tech. Her presentations deliver key details for audiences to be mindful of in their own designs. She is also a senior faculty member at Platt College San Diego and New School of Architecture and design, where she teaches classes on Experience Design, UX/UI, and Interaction Design.


Comments are reviewed before they appear.