This article is based on the first part of the event with Rod Netterfield and Jodie Fieldingof Humind, where Rod shared a story of working on a higher education journey mapping project with 300+ participants.
We’re used to talking about journey mapping for B2B and B2C customers: people that use digital services, shop at online and offline stores, visit entertainment venues, and so on. But what about universities where the customer is a student? How do you capture their end-to-end journey, get the right people from the institution involved, and create a map that accounts for all campuses and academic groups?
Read on for an education case study walkthrough to get answers to all those questions, along with seven tips on how to make a true-to-life, scalable, and actionable student journey map.
Contents
Setting the scene
The higher education industry in Australia was facing a number of emerging local, national, and global trends and impacts. The journey mapping initiative took place right in the middle of 2020 when campus environments were being largely shut down and moved online in response to the COVID-19 situation.
The project was centered around quite a mature institution. Rod was a part of the small core team, which worked with a much larger group of people from the university community: students, partners, and employees. Over the course of 12 weeks, they created a student journey map using the Double Diamond framework.
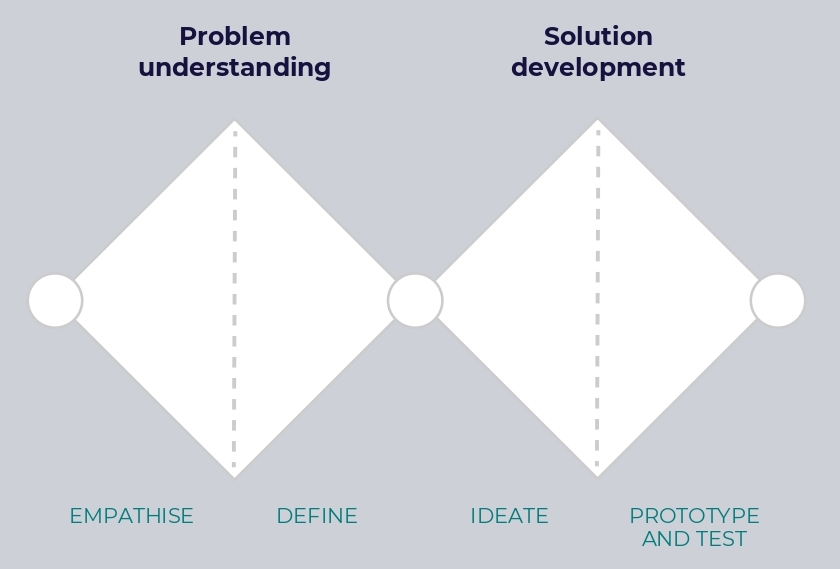
Emphasize, Define, Ideate, Prototype and test.
The goal was to understand and document the end-to-end student experience and make recommendations for strategic and tactical improvements.
Project launch: putting together the team
The first step was determining the project’s scope: where the student journey starts and ends. It actually begins before they are selected to join a higher education institution. Prior to that, students talk to agents and communicate with the admissions office.
The core team received guidance from the initiative’s sponsor and then mind-mapped about 45 participants that they would need along the process. Some of those people were beyond the areas directly within the team’s control but still had an influence on the student’s journey.
The more people work on a mapping project together, the harder it is to get them all in a room at the same time. So next, the team invited colleagues and partners to a series of kickoff workshops, where people could just come to one or the other based on their availability. The goal was to validate a high-level draft of what the core team thought the end-to-end journey looked like.
Tip 1: Figure out what you already have and use it
“What we encouraged was for people to empty out their desk drawers or their virtual desk drawers. So it was about reports, data sets, or business cases, or even journey maps or process maps done for smaller projects. We asked them to bring everything to help us see what we already have.”
Finally, there was a ‘Known and Unknown’ workshop. In these they asked people about the things they didn’t understand, plotted it against the map, and prioritized it. Before going out and talking to students, the team wanted to figure out what were the most important things that they would need to find out.
Engaging students to work together
The total number of students who provided input and feedback into the project was 325. To get their feedback and input on the journey, the team did interviews, focus groups, and observational research sessions, as well as diary studies and online activities. Next, they amassed information from these engagements.
Tip 2: Get a sufficient student sample
“Often in journey mapping, you've gone out, you've spoken with 10 customers or 20 customers, and that’s it. 325 is a very large number. In our specific educational institution, there were also multiple campuses, and a lot of academic groups or faculties. So we wanted to make sure that we had involved enough students that were part of a health area, or a business area, or a sciences area, and so on.”
The team needed to make sure that they weren’t just capturing an aggregate journey but actually understood what the experience was like on a campus-by-campus and faculty-by-faculty basis. It was almost like a big matrix that they were trying to fill in, making sure they’d gotten enough students in each of the boxes.
Putting the data together
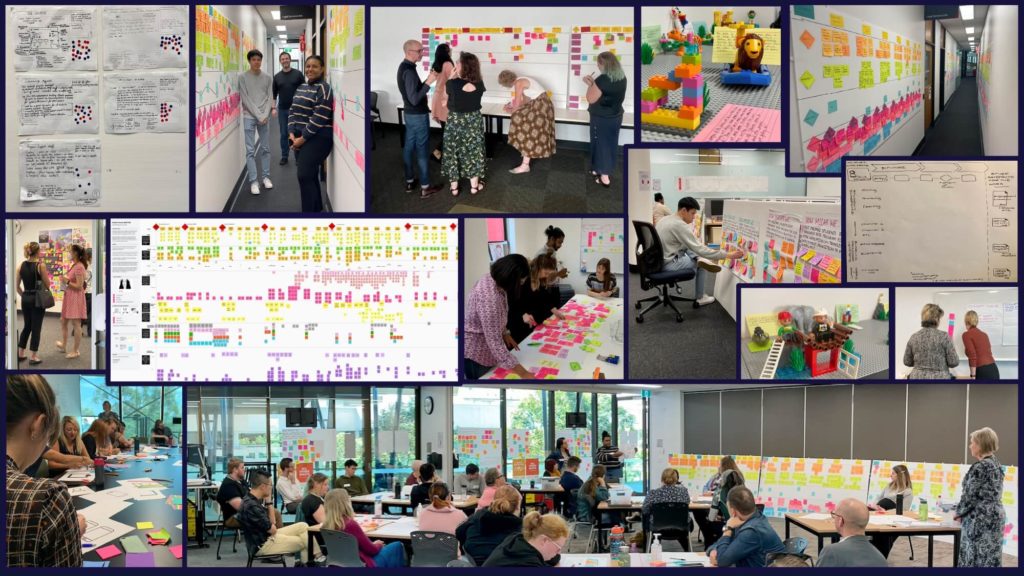
The more data you have, the more time and effort it takes to process it. So the team decided the best approach would be to ask for help. Five colleagues joined them to form a broader group, and the extended team worked together in a more tangible and hands-on way.
The team also sought support from students who came on board as part of the project. From a student's perspective, it was good because many of them were learning about some of those tools, techniques, and techniques in their classes. They were able to get real skills in applying that theory to a real case.
Tip 3: Involve students to get a more realistic representation of their journey
“As we had students doing a lot of the synthesis and analysis of the contributions, it made it more authentic in terms of what it sounded like. As opposed to it sounding really corporatized, when we got to the end of the journey map, it sounded like… something a student would really say.”

Dealing with large volumes of data requires a special environment. These days, luckily, there are a lot of great tools, including low-cost and no-cost ones.
Tip 4: Look for tools to save time and effort
“There are some great no-cost tools out there which can help us get large volumes of data, particularly unstructured text data, analyze, and distill that into themes. At the same time, when we're thinking about doing interviews or focus groups, there's now greater transcription services that are getting much, much stronger in terms of accuracy, which really helps clunk through a lot of heavy person hours.”
Somewhere in the middle of the project, between the ‘Define’ and ‘Ideate’ phases of the Double Diamond framework, another COVID-19 related lockdown hit Australia. So the team had to figure out how to continue research despite the restrictions. Luckily, they’d mostly gathered the data they needed at that point, so it was more a question of transferring it to online tooling.
Tip 5: Store or at least have a backup of your data online
“We had some really, really big coreflute boards that we would literally move around the university campuses with us. We had to transfer all of that data into online tooling. So it was fortunate we did have an online collaboration tool until we could move to the university. We were able to continue all of our workshops and were lucky that our research tool was already an online-enabled platform.”
The finished product: a student journey map + extras
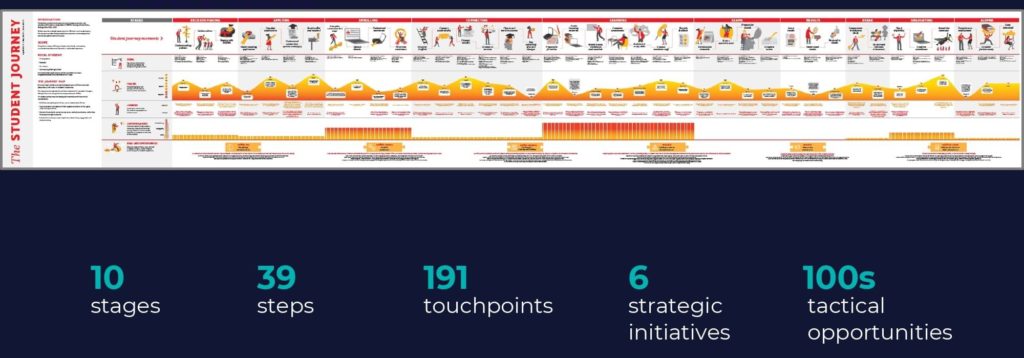
With a project this big, the journey map was bound to be quite extensive as well. And so it was: the finished product that was made publicly available was a document of 10 stages, 39 steps, and 191 touchpoints. The resulting end-to-end student journey map was both digitized and provided as a hard copy.
Tip 6: Create more deliverables with the data that didn’t make it into the map
“We were amassing all of this data about the process, systems, data touchpoints, and all this. And so rather than just discarding it, we cataloged, categorized, and mapped that as well. It was kept unpublished as a team deliverable so that we could leverage it for future projects. Our unpublished product was probably more of a service blueprint, and there was just as much value in that for us as a team.”
Turning insights into action
Essentially, after the first three phases of the Double Diamond framework were over, the team went through the final, ‘Prototype and test’ stage. There, they worked out the most critical-priority pain points and the challenges or opportunities they were trying to solve. Continuing to involve students, colleagues, and partners and making the map readily available also helped speed the implementation along.
Tip 7: Zoom in on the aggregate journey to discover different experiences
“Outside the published product, we started getting requests from people for slices-and-dices of that data. This is where the benefit of a really large sample came in. So other than the aggregate journey map, we were able to produce samples for different personas or different segments: a particular campus, a faculty or academic group, etc. Specific segments or persona groups ended up having a very different experience from the main (aggregate) journey. So we discussed how we might apply different treatments, projects, or initiatives to correct that.”
Three big takeaways
If your goal is to visualize a student’s journey, there are key considerations to keep in mind: a broad spectrum of different experiences and interactions happening across campuses and faculties and an extended amount of data that comes with it.
Approach your next project with these three major things in mind:
- Leverage what you already have.
The only way to deliver a student journey map with pace is to look at what you already have and use it. This can be about emptying desk drawers or looking at things people already know or have. It can also mean working with the tools that you already have rather than going through the procurement process.
- Get the right tools to help you be more efficient.
There is an increasing number of tools that are improving in quality, particularly low-cost and no-cost ones, that can help you along the process. And with that, you can engage with larger samples of people, seek out underrepresented voices, or interact with students, or customers, in different ways.
- It’s a team sport.
The ‘team’ is not just your whole organization but also your customers, partners, and suppliers. Take those people on the journey with you.
The recording
Watch the full recording of our event with Rod and Jodie for a lively conversation, even more details and examples from the case, and a Q&A session.
Or check out the post on Jodie’s financial services customer experience case if you prefer reading.
Rod Netterfield is a co-founder and director of Humind: a new CX design and consultancy collective aimed at helping organizations discover, design, and deliver experiences with the human in mind. Rod has a 15+ year career working for a variety of mid-tier and large global organizations, designing, and implementing CX strategies.

Making such a huge artifact in just 12 weeks is impressive! We’ve also tried creating a student journey map in class when I was getting a sociology degree. But of course it wasn’t nearly as big 🙂 Great case.
Comments are reviewed before they appear.